- by New Deal democrat
For the past few months, I have suspected that a sharp deceleration beginning with the consumer sector of the economy was more likely than not. The retail sales report for March was consistent with that suspicion.
Nominally retail sales rose +0.5% in March, but since consumer prices rose 1.2%, real retail sales declined -0.7%. Further, they are up only 0.2% from last May (using that month because March and April were the stimulus months):
Typically a YoY decline in real retail sales is a recession indicator. Since compared with last March, sales were down -1.5%:
ordinarily I would be worried. But since last March and April were temporary post-stimulus spending sprees, I think the comparison with last May is a better one.
Thus the big takeaway is that real retail sales have been esssentially flat beginning last May. That’s not recessionary, but it’s not good either. In other words, this report remains consistent with a slowdown in the consumer sector of the economy.
Next, let’s turn to employment, because real retail sales are also a good short leading indicator for jobs.
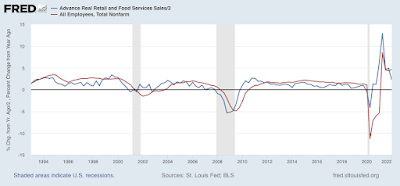
As I have written many times over the past 10+ years, real retail sales YoY/2 has a good record of leading jobs YoY with a lead time of about 3 to 6 months. That’s because demand for goods and services leads for the need to hire employees to fill that demand. The exceptions have been right after the 2001 and 2008 recessions, when it took jobs longer to catch up, as shown in the graph below, averaged quarterly through last month:
Through February recently the two have been in near-perfect sync, at roughly +4.5% YoY. With real retail sales now essentially flat for the last 10 months, I continue to expect the string of monthly jobs reports averaging 500,000 or more will end in several more months. Whether we get a negative print at some point before the end of summer will depend on whether sales continue to go sideways, improve, or deteriorate.
Finally, real retail sales per capita is one of my long leading indicators. Here’s what it looks like for the past 30 years:
These are down -2.7% since last April, and down -0.6% since last May, although unlike the year immediately before both of the last two recessions the trend is also higher by +1.6% since last July. On a mechanical basis this remains a negative signal, and continues to reinforce the long leading forecast of a stall or near-stall in the economy by about the end of this year.


