- by New Deal democrat
Consumer prices increased 0.8% in February, the fourth time in five months that it has exceeded 0.5%. YoY inflation is now 7.9%, the highest rate since 1982. My favorite measure, CPI ex energy, is also up 6.6% YoY, the worst since the 1981-82 recession as well:
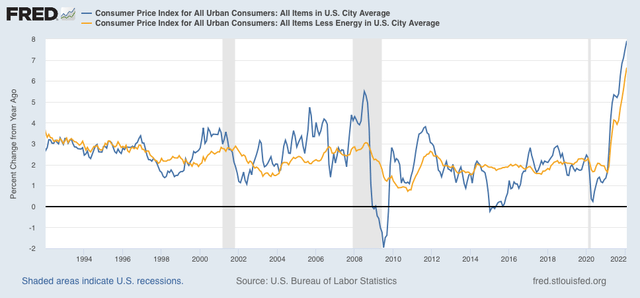
My rationale for tracking CPI ex-energy is that, unless energy costs filter through into the broader economy, there is no cause for alarm. But if the wider economy shows a sharp increase, then there is likely to be aggressive action by the Fed to bring the rate of inflation down, and that means slowing the economy, or even putting it into reverse.
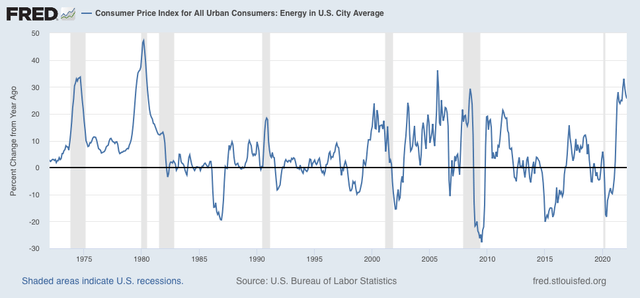
Indeed, energy increased 3.5% for the month, which believe it or not is nevertheless within its normal monthly range for the past 25 years. YoY energy prices for consumers are up 26%, below their 33% peak from last November. This is just below their YoY peaks in 1974, 1979, 2005, and 2008 - not coincidentally 3 out of 4 of which coincided with deep recessions:
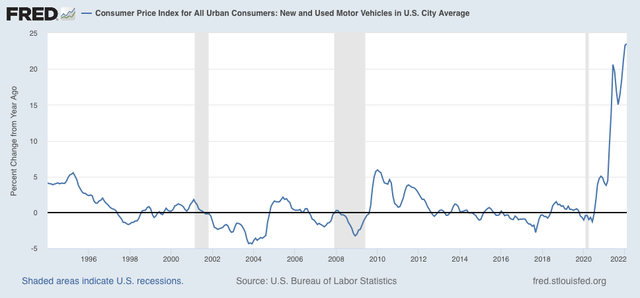
Prices of new and used vehicle prices were unchanged in January, but up 23.5% YoY, another all-time high:
As I have accurately forecast for months, house price increases (blue, /2 for scale) have continued to feed through into rents and “owners equivalent rent”(red), which constitutes 1/3rd of the entire inflation index, and in turn has also continued to increase, and is now up 4.3% YoY - a rate that now exceeds its YoY peak during the housing bubble, and is the higher at since 2002:
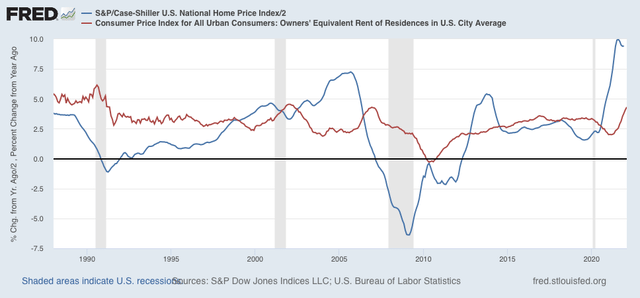
What happened in the case of both prior cases where owners equivalent rent surged after house prices did - 2000 and 2006 - the Fed stepped in and raised rates aggressively, in both cases resulting in recessions, which in turn caused the rate of overall inflation to decline:
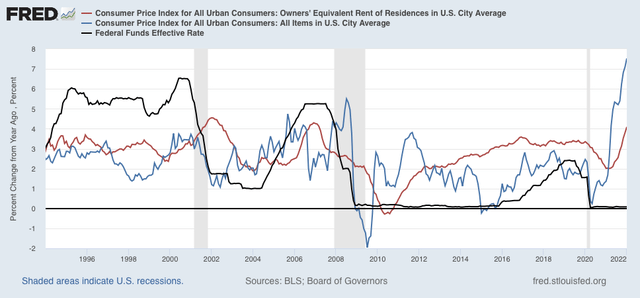
That the Fed will raise interest rates at its meeting next week is all but certain, with the debate about whether it will be .25% or .5%.
The big issue is whether the Fed can still achieve its desired result of a decline in inflation, without causing a recession. For that I along with everybody else look at the yield curve. While rates have been tightening across the board - for example, the heavily-followed 10 minus 2 year spread (blue) is currently 0.27%, and the 5 year minus 3 year spread, often the first to invert (red), is only 0.03%:
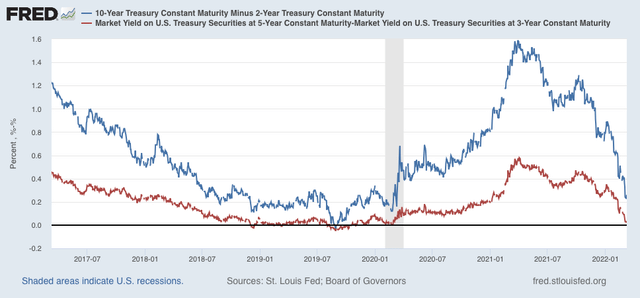
it is still consistent with an economy 2 or 3 years before a recession hits:
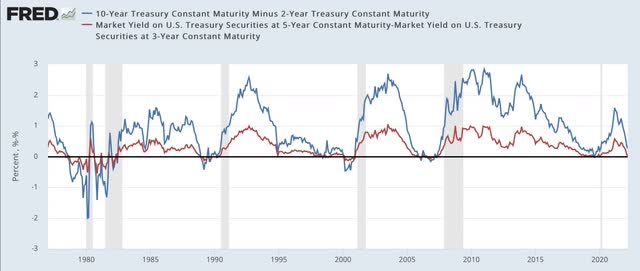
As I wrote one month ago, in hindsight it is pretty clear that the Fed fell behind the curve, failing to realize that big increases in house prices beginning in late 2020 were going to filter through into the broader measure, and begun to lay the groundwork for tightening to start slowly perhaps by the end of last summer. Since the Fed - like me and lots of other people - probably figured the US population would be fully or nearly fully vaccinated by last autumn, bringing the pandemic to an effective end, thus bringing labor and supply shortages to an end as well, its view was understandable. But here we are.
I’ll discuss the effect of this report on wages tomorrow.