- by New Deal democrat
Here is my weekly update on the 2020 elections, based on State rather than national polling in the past 30 days, since that directly reflects what is likely to happen in the Electoral College.
The theme this week is that Trump’s approval is reverting to the mean, and so are the Presidential polls.
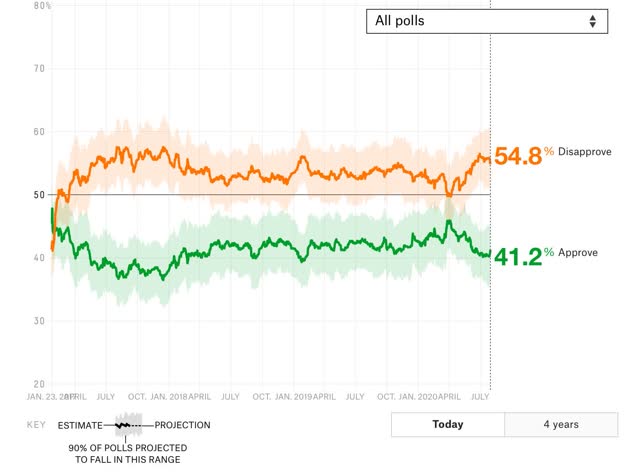
Here is Nate Silver’s Trump approval vs. disapproval graph:

For most of the past month, Trump approval has been languishing at 40%, equivalent to the worst levels of his Presidency. But as always been the case before, his partisans come back to approving him after the immediate moment has passed.
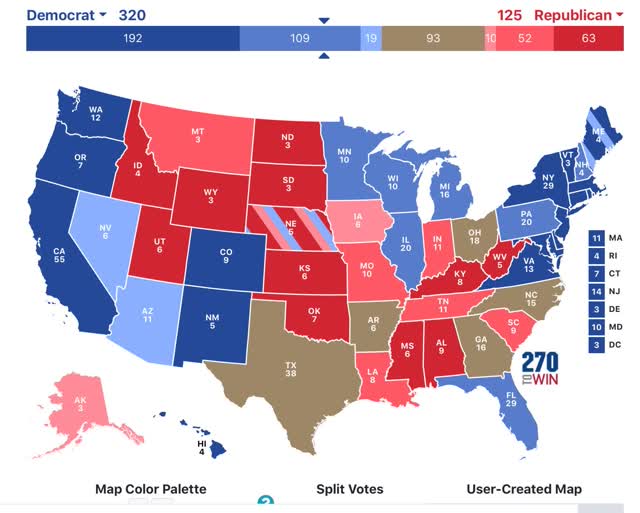
This is reflected in the Presidential polling. To refresh, here is how the below map works:
- States where the race is closer than 3% are shown as toss-ups.
- States where the range is between 3% to 5% are light colors.
- States where the range is between 5% and 10% are medium colors.
- States where the candidate is leading by 10% plus are dark colors.
Here is the updated map through August 1:

While there have been no outright flips, note that North Carolina has gone back to being a toss-up. Nevada plus several States in the midwest are less strongly pro-Biden. Meanwhile South Carolina and several other States in the Deep South have turned more pro-Trump.
- States where the range is between 3% to 5% are light colors.
- States where the range is between 5% and 10% are medium colors.
- States where the candidate is leading by 10% plus are dark colors.
Here is the updated map through August 1:

While there have been no outright flips, note that North Carolina has gone back to being a toss-up. Nevada plus several States in the midwest are less strongly pro-Biden. Meanwhile South Carolina and several other States in the Deep South have turned more pro-Trump.
Even so, as has been the case for nearly a month, if Biden simply wins the States in which he leads by 5% or more in the polling, he would win the Electoral College, without even winning a single “toss-up” or “lean Biden” State as shown on the map.
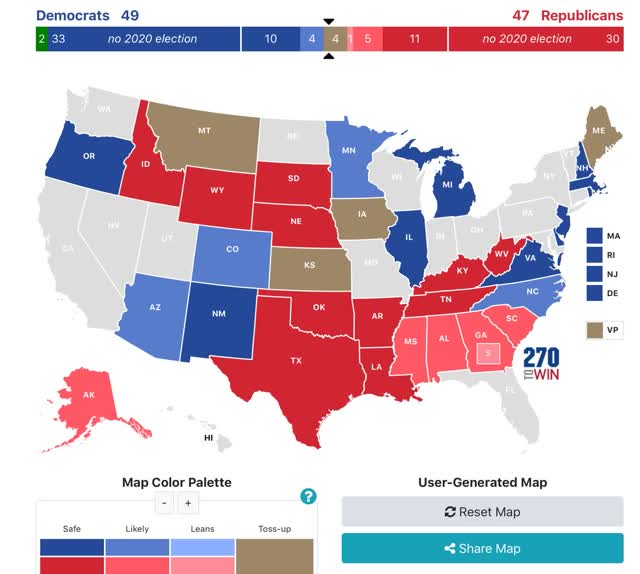
Here is what the 2020 Senate map looks like based on the same metrics, with the following changes:
Here is what the 2020 Senate map looks like based on the same metrics, with the following changes:
- where there is no polling in the past month, I have used the most recent poll
- where there has been no polling at all this year, I am using the Presidential polling as the best guess.

Note that there has been no polling at all this year in the following States: Oregon, Idaho, Wyoming, South Dakota, Nebraska, Louisiana, Arkansas, Rhode Island, and West Virginia.
Most importantly, note that Maine has tightened back to a toss-up. This is likely to be the race that determines whether or not the Democrats achieve a majority in the Senate.
I am quite concerned about what reversion to the mean will do in Senate races. In the Presidential race, I continue to believe that Trump has until Labor Day - about 5 weeks - to pull off a miracle as to the pandemic. More likely we will start to see outbreaks in schools among teachers and students, and then their parents, by about September 20. Hospitalizations based on those outbreaks will start to increase in early October, and deaths in late October, just in time to be the last big story before Election Day.