- by New Deal democrat
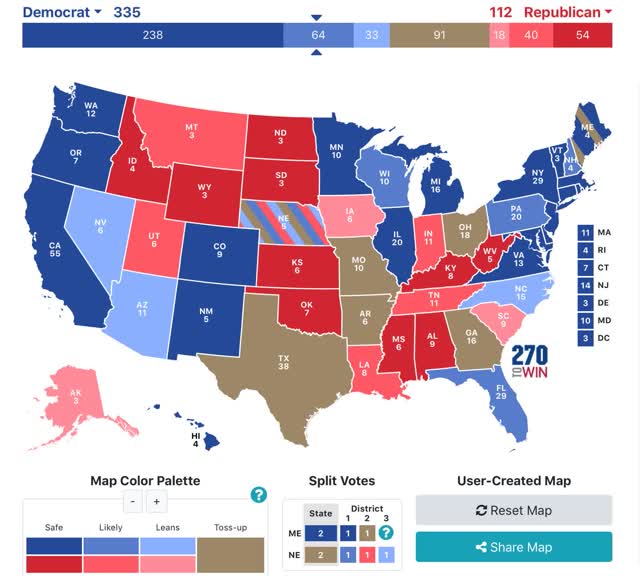
For the past five weeks I have posted a projection of the Electoral College vote based solely on State rather than national polls (since after all that is how the College operates) that have been reported in the last 30 days, using the following formula:
- States where the race is closer than 3% are shown as toss-ups.
- States where the range is between 3% to 5% are light colors.
- States where the range is between 5% and 10% are medium colors.
- States where the candidate is leading by 10% plus are dark colors.
As I emphasized last week, polls are really just nowcasts, snapshots in time that will change as circumstances change.
To cut to the chase, there are no changes this week compared with last week. Biden is leading comfortably in the Electoral College vote, not even counting States that are only “leaning” in his direction:

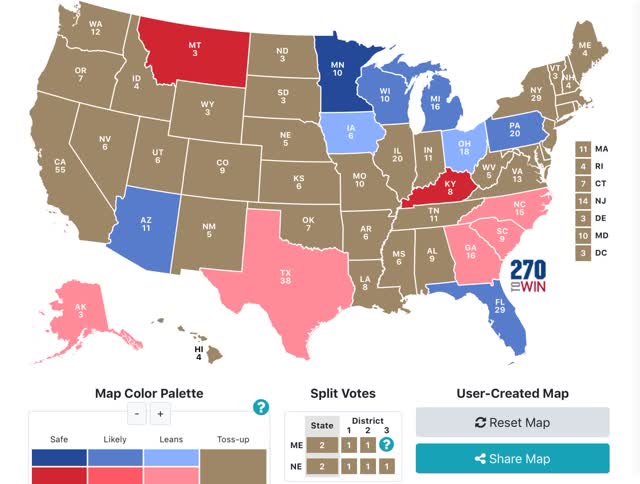
But there has been a fair amount of polling in the past week or so. The below map shows only those States that have been polled in the last 10 days. The only change in the color coding is that any “lean” of even less than 1% is shown in the appropriate color (to differentiate polled from non-polled States):

As I’ve been anticipating, it looks like there is a small “reversion to the mean” particularly occurring in the States of the Confederacy, but also note Ohio, which was just polled for the first time in several months, and showed a slight Biden lean.
Next, last week I wrote that I would very much like to see more State polling in the red States, because there are GOP Senators who should be targeted that we don’t even know are vulnerable as of this point.
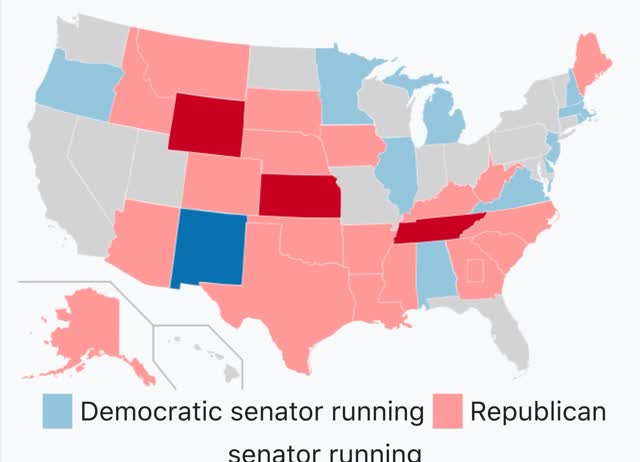
To demonstrate that, below are two maps. The first shows those Senate seats that are up for elections in 2020:

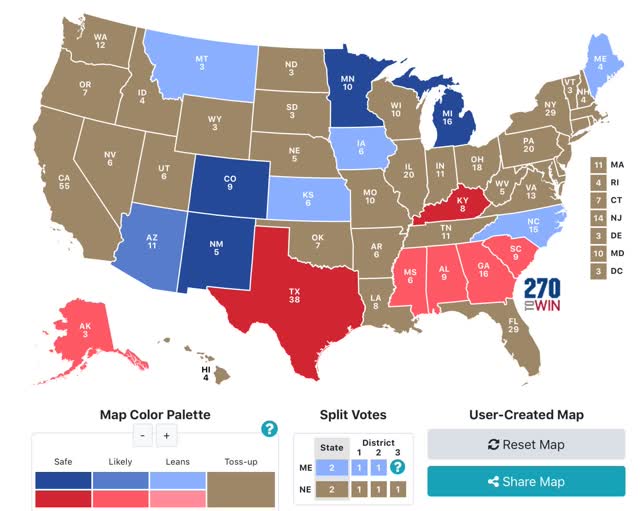
Now here is a color coded map based on all Senate polls in those States for the last 60 days (again, coding even very slight “leans” in the appropriate color to differentiate from non-polled States):

I want to emphasize several things about this second map. First of all, with the exception of Montana and Kansas, which are *extremely* tight, all of the other races have shown *consistent* leans in the same direction. As a result, I am not terribly sanguine about any Democrat’s chances in the Deep South, even though Georgia and South Carolina have been polling relatively close. It is also pretty clear that Democrats donating to the Texas and Kentucky races are throwing their money away. That same amount of money would go a long way in Maine, Iowa, Montana, and help in North Carolina as well.
- States where the race is closer than 3% are shown as toss-ups.
- States where the range is between 3% to 5% are light colors.
- States where the range is between 5% and 10% are medium colors.
- States where the candidate is leading by 10% plus are dark colors.
As I emphasized last week, polls are really just nowcasts, snapshots in time that will change as circumstances change.
To cut to the chase, there are no changes this week compared with last week. Biden is leading comfortably in the Electoral College vote, not even counting States that are only “leaning” in his direction:

But there has been a fair amount of polling in the past week or so. The below map shows only those States that have been polled in the last 10 days. The only change in the color coding is that any “lean” of even less than 1% is shown in the appropriate color (to differentiate polled from non-polled States):

As I’ve been anticipating, it looks like there is a small “reversion to the mean” particularly occurring in the States of the Confederacy, but also note Ohio, which was just polled for the first time in several months, and showed a slight Biden lean.
Next, last week I wrote that I would very much like to see more State polling in the red States, because there are GOP Senators who should be targeted that we don’t even know are vulnerable as of this point.
To demonstrate that, below are two maps. The first shows those Senate seats that are up for elections in 2020:

Now here is a color coded map based on all Senate polls in those States for the last 60 days (again, coding even very slight “leans” in the appropriate color to differentiate from non-polled States):

I want to emphasize several things about this second map. First of all, with the exception of Montana and Kansas, which are *extremely* tight, all of the other races have shown *consistent* leans in the same direction. As a result, I am not terribly sanguine about any Democrat’s chances in the Deep South, even though Georgia and South Carolina have been polling relatively close. It is also pretty clear that Democrats donating to the Texas and Kentucky races are throwing their money away. That same amount of money would go a long way in Maine, Iowa, Montana, and help in North Carolina as well.
But most importantly, note the almost complete lack of polling in the High Plains and Mountain West. These are small States in terms of population and cost of media markets, but their Senate votes count just as much as the largest States. Where there has been polling - Iowa, Montana, and Kansas — the Democratic candidates are extremely competitive.
So there is a crying need for more polling in these States, and also New Hampshire, and maybe even West Virginia. If there is going to be a “blue wave” Presidential election, we are needlessly flying blind as to potential inexpensive pick-ups in an expanded Senate map.