- by New Deal democrat
As you know, I’ve been monitoring initial jobless claims closely for the past few months, to see if there are any signs of a slowdown turning into something worse. Simply put, if businesses aren’t laying employees off, those same people are consumers who are going to continue to spend, which is 70% of the total economy. So the lack of any such increase has been the best argument that no recession is imminent.
This morning’s report of 214,000 initial claims returns us to the 2018-19 average, while the 4 week average of 223,500 remains slightly elevated (possibly due to seasonality issues).
To reiterate, my two thresholds for initial claims are:
1. If the four week average on claims is more than 10% above its expansion low.
2. If the YoY% change in the monthly average turns higher.
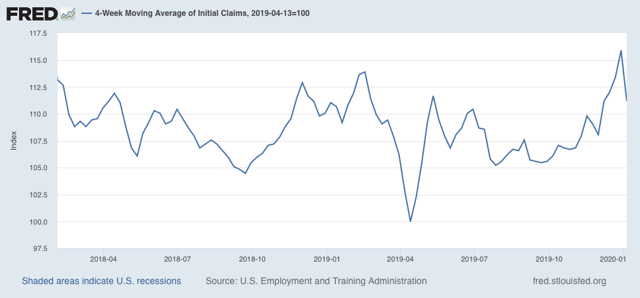
At 223,500, the 4 week average is 11.2% above the lowest reading of this expansion, which occurred last April:
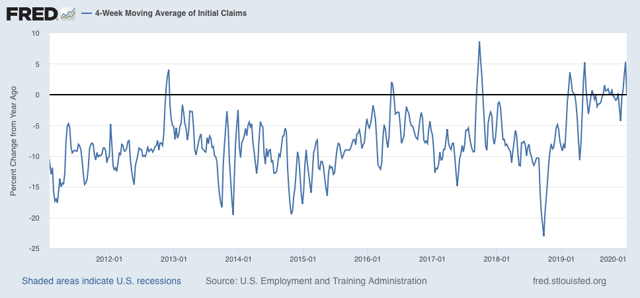
On a YoY% change basis, the 4 week average is on +250, or +0.1% higher:
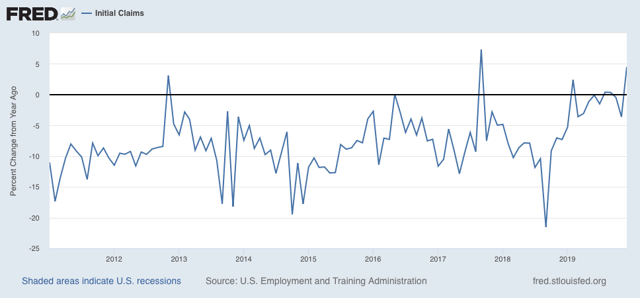
The latest monthly average remains December, which was +4.6% higher than December 2018:
Only one of the two thresholds is crossed, and that is probably due to seasonal quirks having to do with Thanksgiving being one week later in 2019 vs. 2018.
This removes the “red flag” of the past two weeks, but the cautionary “yellow flag” remains.
Meanwhile, the less volatile 4 week average of continuing claims is 2.1% above where it was a year ago:
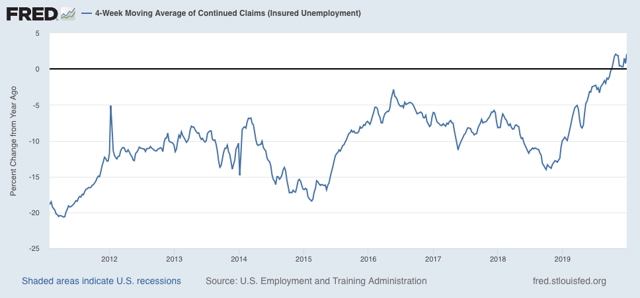
Here is the longer term graph:
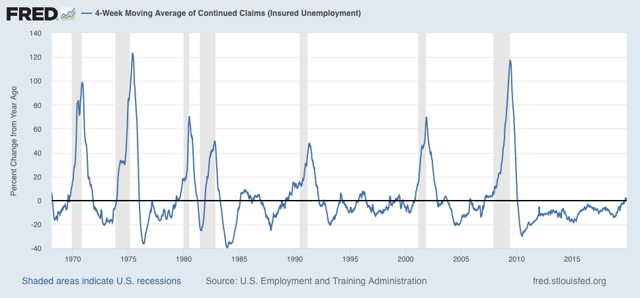
This remains consistent with a significant slowdown. But there have been similar readings in 1967, 1985-6, 3 times in the 1990s, and briefly in 2003 and 2005, all without a recession following. So the threshold for continuing claims being a negative (vs. neutral) has not been met.
Bottom line: unless initial claims are reported in the 230’s without seasonal flukes (or 15%+ higher than their lows), and continuing claims continue to trend higher, into the 1.750 million range or higher, there is no recession flag. The slowdown hypothesis vs. recession remains the most likely outcome.
ADDENDUM: Since tomorrow is jobs day, let me haul out the graph of initial jobless claims (averaged monthly, blue) vs. the unemployment rate (red):
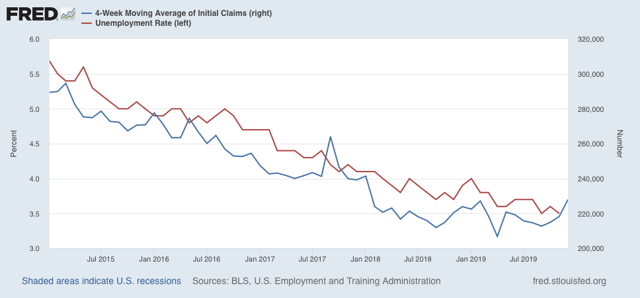
In the long term historical view (not shown), the unemployment rate lags initial jobless claims by about 1-3 months. So I’m not expecting any further decrease in the unemployment rate, and there is a fair probability of an increase in tomorrow’s report.