- by New Deal democrat
I’ll have more to say next week, but for now here are the headlines on this morning’s data.
Taken together, production and employment are the King and Queen of coincident indicators - certainly in terms of how the NBER scores expansions and recessions. Both February industrial production and January JOLTS for employment were reported this morning, and delivered differing messages.
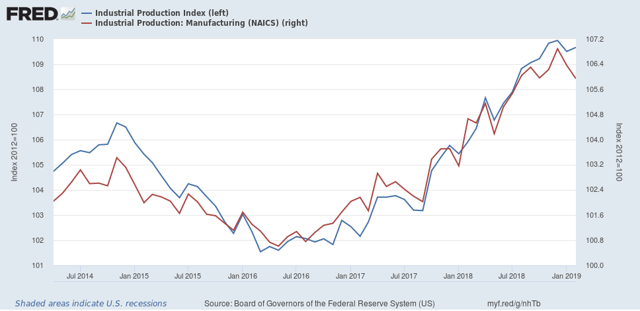
First, industrial production for February was weak. While total production gained slightly (+0.1%), manufacturing production declined for the second month in a row:

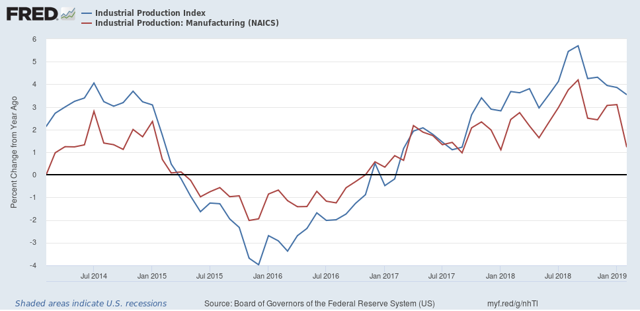
Here is what that same data looks like measured YoY:

There may have been a production boom last summer, but it’s over now.
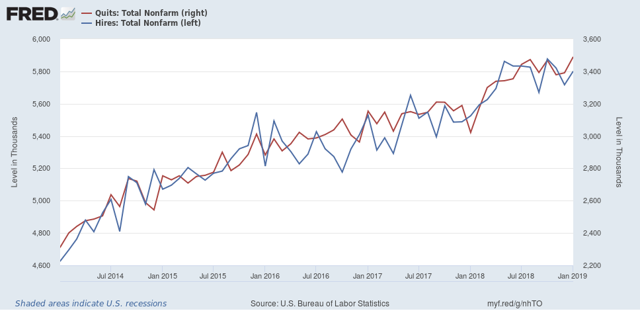
If industrial production is the King of Coincident Indicators, then employment is the Queen. The JOLTS report for January, which included substantial revisions for all of 2018, included an all-time high in the number of quits (red), and an improvement in hires (BLUE):


Not shown, but layoffs and discharges made a new 12 month low, and openings were just below theirs. If there is a fly in the ointment, it is that since midyear 2018, there has been very little improvement in all of the JOLTS metrics except for layoffs and discharges.
Basically, production and employment taken together show deceleration since summer of 2018, with production actually contracting slightly while employment continues to improve.