- by New Deal democrat
Yesterday's surprisingly poor initial jobless claims report of 379,000 was certainly a head-scratcher. I didn't see any obvious explanations. At the same time, coming in the middle of the holiday season, only two weeks after a 298,000 report, and with no other economic data showing any serious signs of tanking, my inclination is to treat it as noise and wait to see if a few more weeks sorts the matter out.
But let's go deep into the weeds for this one.
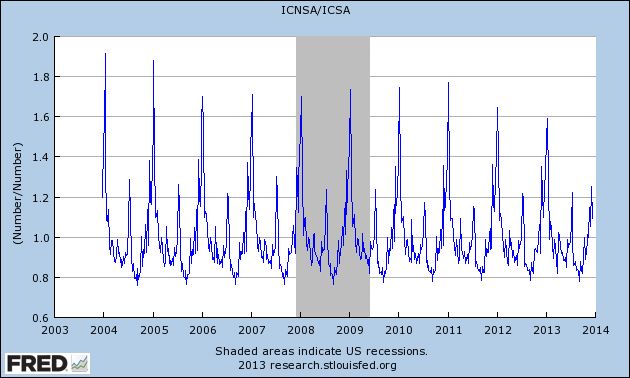
To begin with, December seasonal adjustments can be huge. Here's a graph of non-seasonally adjusted initial jobless claims divided by seasonally adjusted claims for the last 10 years:

It's pretty easy to see that we are at the time of year when the largest seasonal adjustments of the year take place.
Not only that, but the variation just from week to week can be large. For example, the adjustment in the previous week was ~0.80. Last week it was ~0.92. Had the previous week's seasonal adjustment been used, jobless claims would only have been reported at 331,000!
Even for this reference week, which creeps by a day or two YoY, the adjustments can vary substantially. This year's 0.92 is the smallest adjustment for the reference week in the last 10 years. Last week it was 0.91, but in 2004, 2005, and 2009 the average of the two closest reference weeks was 0.85 - which would give us a report of 343,000. In other recent years, it would have been higher than 343,000 but lower than 375,000.
None of this is to fault the DOL, The point is simply that seasonal adjustments are particularly prone to noise at this time of year.
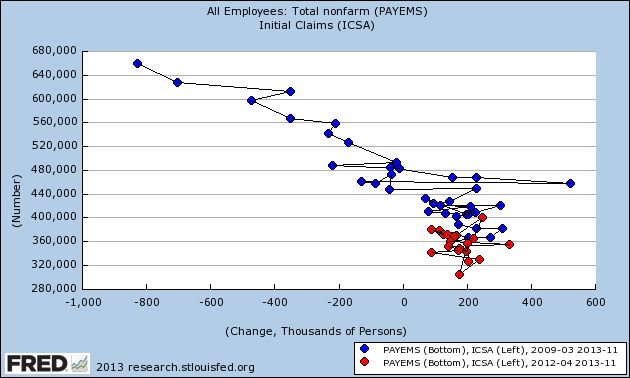
Other evidence that seasonality may be playing havoc with the claims number comes from the fact that, as I've said a number of times before, weakness starts with a slowdown in hiring before there is an increase in firing, i.e., hiring precedes firing. Below is an update of a scatterplot graph I've run before comparing the monthly jobs report (net hiring) with the monthly average of new jobless claims (firing), in which the last 20 months are highlighted in red:

Before a recession, the scatterplot points shift significantly to the left. But as you can see from the above, while the points have stagnated, there has been no significant shift to the left in recent reports.
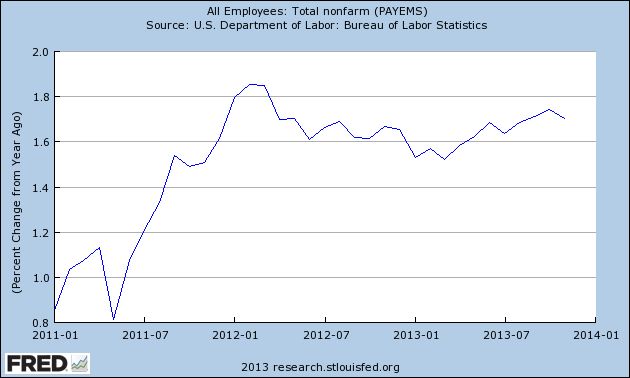
Further evidence of the relative strength in hiring comes from this graph of the YoY% change in jobs, which has been showing a slight increase during this year:

This is simply not something I would expect if we were on the cusp of a near-recession.
Also, even if there is "signal," it still may be affected by the season. Last year, due to tax shifting, there was a huge spike in personal income in November and December. That was reflected in large gains in the 14 day average of Gallup's daily consumer spending report, which ramped up from $65 in November to $90 in December 2012. This year in the equivalent period spending has only increased from about $87 to $100 at its peak so far.
What follows is my best guess, so take it with appropriate grains of salt, but if retailers mistakenly expected a similar ramping up this year, they have been sorely disappointed. Not to mention, in many parts of the country there have been some unusually significant December winter storms, which kept shoppers home. Those retailers may have begun layoffs of seasonal hires early, which would have a heightened impact on the jobless claims reports.
The bottom line is, while it looks like some actual signal (in most years, even with the seasonal adjustment, the number would have been reported as 350,000 or more), there is an excellent chance that this week's jobless report is still primarily seasonal noise.