- by New Deal democrat
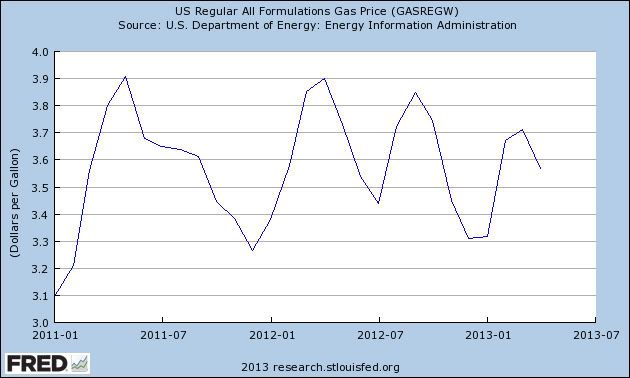
Gas prices for the final week of April were reported yesterday, showing yet another $0.02 decline. For the month, gas prices in April averaged almost 4% less than prices in March:

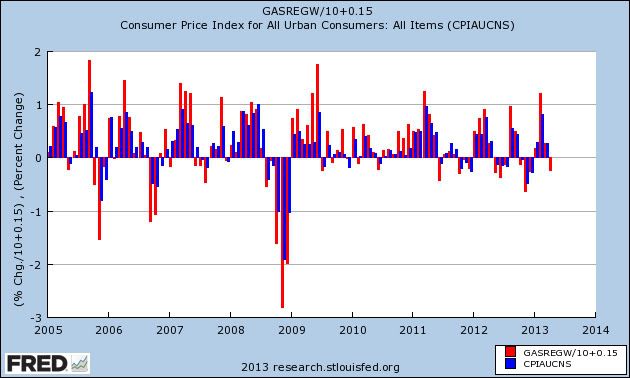
As I've noted before, a reasonable estimate of how gas prices affect overall consumer prices is to take the change in gas prices, divide by 10, and add 0.1% or 0.2%. That will come close to the non-seasonally adjusted change in consumer prices. (If you want to be more conservative, you could divide by 12 or even 16, but that only changes the ultimate result by +0.1). Here's a graph showing that relationship for the last 9 years as a sample (blue is gas prices, red is CPI):

It certainly isn't a perfect relationship, but it is usually quite close.
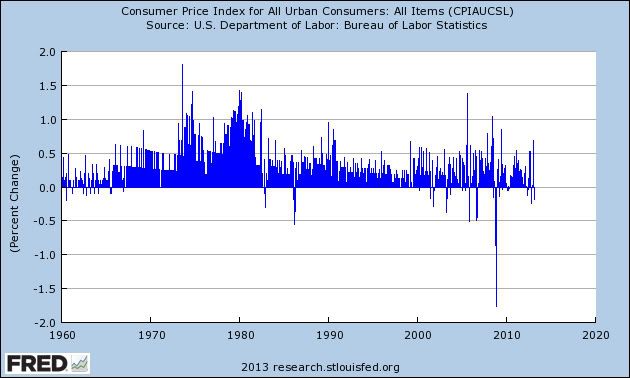
Applying that to April 2013, we get -0.4% + 0.1% or +0.2%, for an estimate of -0.2% or -0.3% non-seasonally adjusted CPI. Since the seasonal adjustment for April will be about -0.3%, the seasonally adjusted inflation rate for April is likely to be close to -0.5%.
If that happens, it will make for one of the most deflationary readings in 50 years, outside of the drastic late 2008 deflation during the great recession (only one month in 1986 and several in 2006 are equal):

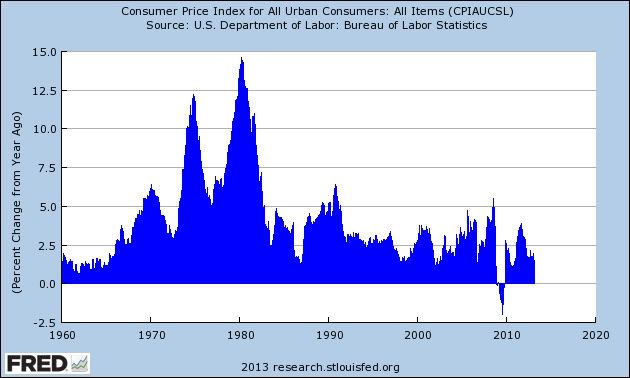
Further, YoY inflation will be about +1.0%, also matching the lowest inflation rate in 50 years outside of the great recession (only 1963, 2002, and 2006 saw YoY inflation of only 1.0%:

Barring a bad accident in Friday's employment report, this will also produce the best YoY advance in real wages in over 2 years.
The surprise easing of the oil choke collar is one of the biggest economic stories so far this year.