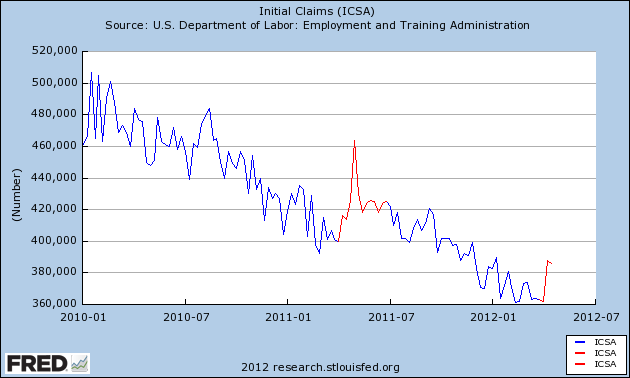
Except that we had the exact same sudden and significant increase in first time jobless claims during the exact same two weeks last year, as is shown in the below graph which highlights April through June last year and claims since April 1 of this year in red:

That suggests that the our recent non-winter winter is not the reason for the difference.
Another suggestion has been that the BLS's seasonal adjustments were thrown off by the pattern during the severe recession, causing first quarter adjustments to bee too low, and second quarter too high. While that may be true, the BLS just a few weeks ago revised the entire series back several years to deal with that exact issue. Also, as the above graph shows, there was no significant increase in Q2 2010.
I propose another explanation. It may well be that the seasonal increase in gasoline prices from January through May or June of both last year and this year to nearly $4 per gallon, thereby tightening the choke collar on the economy, is reflected in an increase in layoffs. In other words, this is a new seasonal pattern that is only showing up in those years where the seasonal increase in gas prices sufficiently tightens the Oil choke collar -- as in 2008, 2011, and 2012.
If my speculation is correct, we will see a pattern very much like last year. Once gasoline prices begin to decline seasonally after midyear, the Oil choke collar will be loosened again, and layoffs will again decline.