This continues my look at leading indicators as they may apply to pre-WW2 deflationary recessions. I have already looked at BAA bonds, housing starts, and commodity prices. Stock market prices, in the form of the S&P 500, of course are part of the modern set of LEI. How did they perform in the Roaring Twenties and Great Depression? Let's have a look.
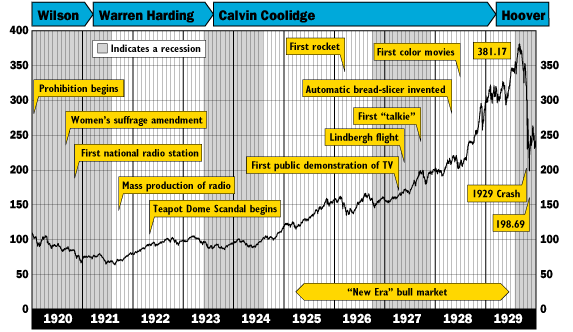
Here is a graph of the DJIA (the S&P 500 wasn't created until later) during the Roaring Twenties:

The 1920-21 recession was very much like the 1981-82 recession. High inflation during WW1 was broken via a deep but short-lived bust. Thereafter while the stock market did accurately top and bottom before the peak and trough of the 1923 recession, it rose right through the 1926-27 recession and infamously topped in September 1929 after the downturn that became the Great Depression had already begun.
For a more detailed look, here is a chart of the yearly highs and lows of the DJIA, with the date of those highs/lows in parenthesis, compared with recession dates:
| Year | Yr. high (date) | Yr. low (date) | Recession dates |
|---|---|---|---|
| 1920 | 108.76 (Apr) | 66.75 (Dec) | 1/20- |
| 1921 | 81.50 (Dec) | 63.90 (Aug) | - 7/21 |
| 1922 | 103.43 (Aug) | 78.59 (Nov) | - |
| 1923 | 105.38 (Mar) | 85.76 (Oct) | 5/23- |
| 1924 | 120.51 (Dec) | 88.33 (May) | -7/24 |
| 1925 | 159.39 (Nov) | 115.00 (Mar) | - |
| 1926 | 166.64 (Aug) | 135.20 (Mar) | 10/26- |
| 1927 | 202.40 (Dec) | 152.73 (Jan) | -11/27 |
| 1928 | 300.00 (Dec) | 191.33 (Feb) | - |
| 1929 | 381.17 (Sep) | 198.69 (Nov) | 8/29- |
| 1930 | 294.00 (Apr) | 157.51 (Dec) | cont. |
| 1931 | 194.36 (Feb) | 73.79 (Dec) | cont. |
| 1932 | 88.78 (Mar) | 41.22 (Jul) | cont. |
| 1933 | 108.67 (Jul) | 50.16 (Feb) | -3/33 |
| 1934 | 110.74 (Feb) | 88.57 (Jul) | - |
| 1935 | 148.44 (Nov) | 96.71 (Mar) | - |
| 1936 | 184.90 (Nov) | 143.11 (Jan) | - |
| 1937 | 194.40 (Mar) | 113.64 (Nov) | 5/37- |
| 1938 | 159.51 (Nov) | 96.95 (Mar) | -6/38 |
| 1939 | 155.92 (Sep) | 121.44 (Apr) | - |
| 1940 | 152.80 (Jan) | 111.84(Jun) | - |
The DJIA did make a trough in 1932 before the end of the contractionary part of the Great Depression, and did both peak and trough before the economic peak and trough of the 1937-38 recession.
Of the 9 total economic peaks and troughs in this period, the DJIA was a leading indicator 5 times, coincident 2 times, and missed one recession altogether. In short, useful but not perfect.