One of the items I always list in my "Weekly Indicators" column is BAA corporate bond yields. Since yesterday I wrote about the existence of economic indicators in the pre-inflationary era before WW2, it's worth revisiting that data, including BAA corporate bonds,because one of the reasons I added it to my list is precisely because we have good data on corporate bonds (both AAA and BAA) for almost a century - since 1919. BAA bonds have shown more reaction to economic conditions, so that is the series I track.
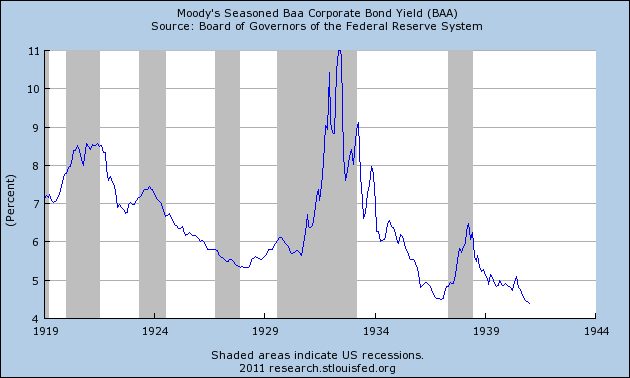
Here is the graph of BAA corporate bond yields from 1919 through 1941:

Note that, with the sole exception of the 1927 recession, BAA (i.e., lower grade) corporate bond prices began to fall, and their yields rise, in advance of the onset of a deflationary recession, and then continued to rise as corporate creditworthiness became more risky during the recessions. BAA corporate bond yields also typically began to decline in advance of the end of the recessions. In short, they functioned as a leading indicator.
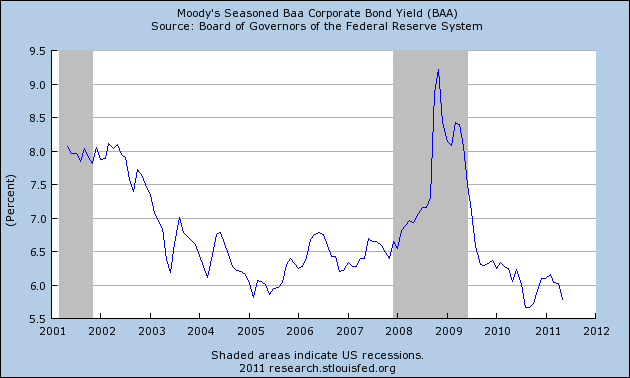
Now let's look at BAA corporate bonds for the last 10 years. Note that there is the same pattern in advance of and during the "great recession" of 2007-09. BAA corporate bond yields began to rise in 2005 and continued to rise as risk of corporate defaults increased during the recession. Yields declined in advance of the bottom of the "great recession" in 2009. Once again, they functioned as a leading indicator.

Now, take a look at the far right end of the graph above, showing 2010 and 2011. Do you notice the rising bond yields in anticipation of worsening corporate creditworthiness?
No? Well, neither do I.
Publicly available leading economic indicators from the pre-inflationary era are not non-existent. Over the next week, time permitting, I'll post some more series that go all the way back to the 1920s or even 1910s.