A few months ago I had the temerity to ask: Is it time to start looking for the end of the housing bust? That's because, in talking about the housing market, it is important to differentiate between housing sales and housing prices. Housing sales have been bouncing along the bottom for over two years. Housing prices, after being temporarily propped up by the housing credit in 2009 and early 2010, have resumed their downward trajectory.
Why does it matter? So long as houses are being built for people who will actually live in them (as opposed to being flipped in real estate deals), increasing new home sales in particular are an unalloyed good. More homes being built means more construction employment, and more employment in all of the sectors of the economy that have to do with furnishing, landscaping, adding to and maintaining the home.
The renewed fall in housing prices is a much more nuanced proposition. Is that good or bad? That, dear reader, depends on whether you are a buyer or a seller. The simple fact is, the more house prices fall, the more potential buyers - especially first time buyers - are able to afford them. The more affordable houses become, the more get sold, eventually working through the overhang of inventory. And the sooner the overhang of inventory is sopped up, the sooner the new home building market can start to recover. While the high rate of unemployment and underemployment means that process is taking longer and is more painful than it should be, the fact is, the process is still taking place. In fact, as we will see, in at least one hard-hit metropolitan area, the price bottom may also already be in.
First, let's look at sales. Below is a graph of housing permits (blue) and new single home sales (red)(this latter series from the NAR):

Both of these plummeted by 75% from their peak at the end of 2005 until early 2009. With a mild temporary assist from the $8000 housing credit, permits have bounced along that bottom for two full years - but the 2009 bottom has held. Single family homes have gradually declined 5% more in the last two years. February set a new low for this latter series.
But before you leap to the conclusion that yet another leg down in sales may be starting, consider the following data from each series from the last 6 months, including averages for each of the three month periods:
Housing permits:
2010-09-01 547
2010-10-01 552
2010-11-01 544 (average 547)
2010-12-01 627
2011-01-01 563
2011-02-01 534 (average 575)
New home sales:
2010-09-01 317
2010-10-01 280
2010-11-01 286 (average 294)
2010-12-01 333
2011-01-01 301
2011-02-01 250 (average 295)
Why average over the three month period? Because for now, February's poor number simply looks like payback for the sudden, big upward jump in December. As commentary at that time noted:
While building permits surprised on the upside (big time) their jump was in large part attributable to a push by builders to get approval for dwellings ahead of changes in the building codes for California, Pennsylvania and New York (these have been in force since the start of 2011).
If March continues February's downtrend, maybe there is something more. Otherwise, the good news is, the bottom in housing sales is still in. The bad news is, there's no upward push whatsoever.
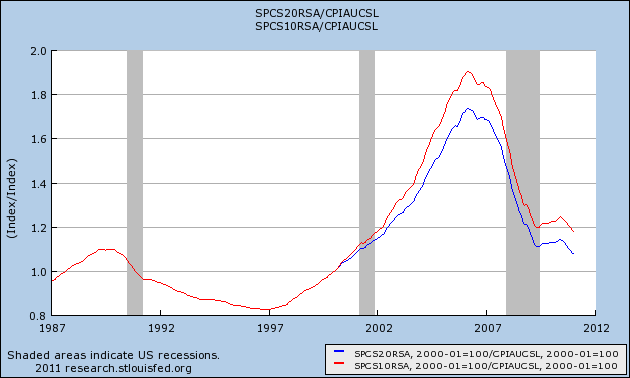
Now let's turn to housing prices. In real, inflation adjusted terms, the 10 and 20 city Case Schiller index of house prices is as low as it has been for 10 years:
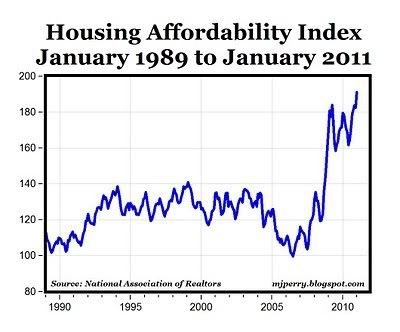
This decline in housing prices, along with the decline in mortgage rates in the last few years, has meant that typical mortgage payments are now smaller as a share of household income than they have been in several decades:
Let me focus in on a couple of hard-hit metropolitan areas that were epicenters of the bubble and then of the bust: Phoenix, AZ and Fort Myers, FL. As in the past, I will be relying on data from Housing Tracker.net - the same data that allowed me to call the top in the housing market in real time in 2006. In 2005 at the height of the bubble, the median asking price for a house in Phoenix was $380,000. As of this month it is $145,000, as shown in this graph of the 25th (blue), 50th (green), and 75th (gold)percentile asking prices of houses in the Phoenix metro area:
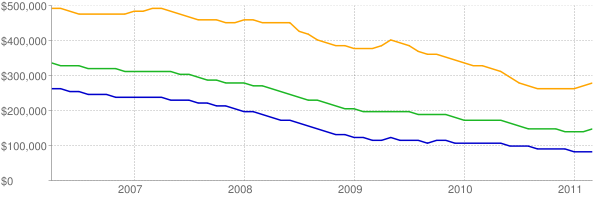
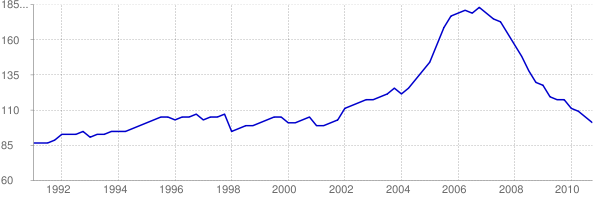
Anyone who bought a house in Phoenix in the last eight years who is selling it now, is probably taking a bath - the house is worth less than they paid for it. But for a first time home buyer in particular, paying $145,000 as opposed to $380,000 is a miracle. And the asking price on the type of house first time buyers would be looking at - one at about the 25th percentile, has fallen from $259,000 in early 2006 to $85,000 now -- a 2/3 decline. Indeed, house prices in Arizona generally are now more affordable compared with median income than they have been in over a decade:
As a result, in the Phoenix area in particular, the housing inventory for sale, which peaked at 48,340 in November 2007, is now back down to 29,656. This is the lowest inventory in 5 years.
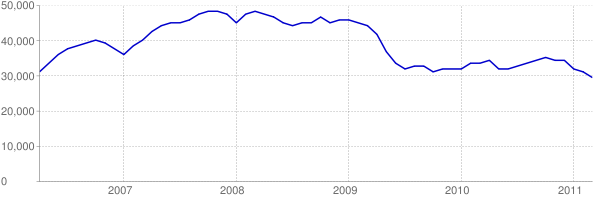
But I've saved the best for last. Let's now look at southwestern Florida (Fort Myers):
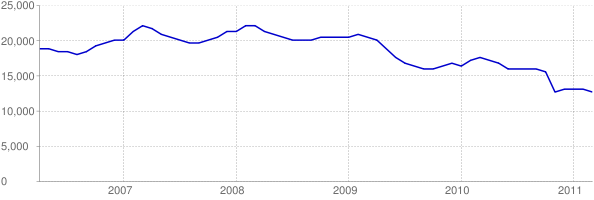
Just as in Phoenix, the number of listings has declined strongly since peaking in February 2008 at 22,335. As of March 2011 they are down to 12,646, the lowest in over 5 years:
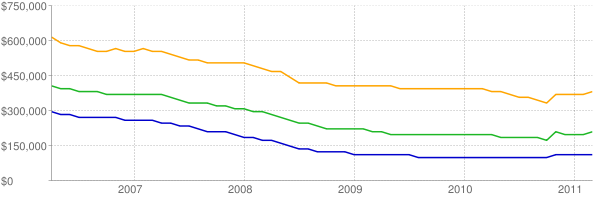
And in this area, for the first time in five years, there is actually evidence that the bottom may already be in, as shown in this breakout of asking prices for the 25th, 50th, and 75th percentile listings:
Indeed, just yesterday Prof. Mark Perry noted that in February Las Vegas also recorded the highest number of home sales in over five years too.
As he summed up:
Isn't this evidence that markets are working? At some point, home prices fall far enough to start bringing buyers back into the market, and sales increase.
Indeed.