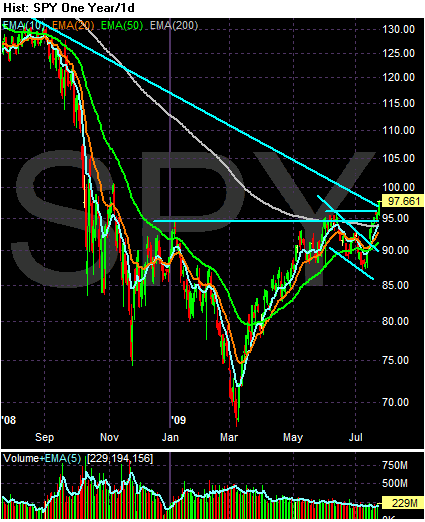
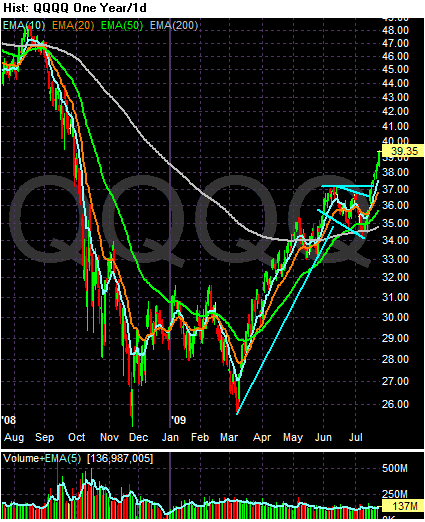
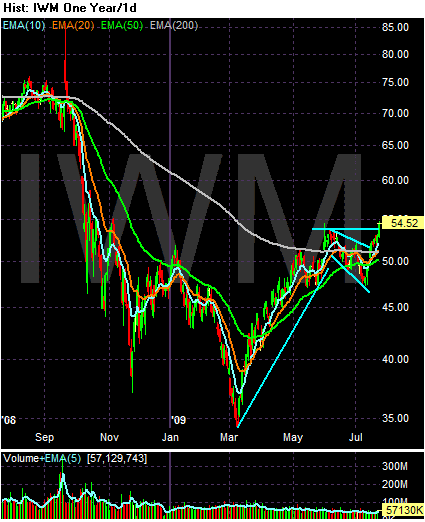
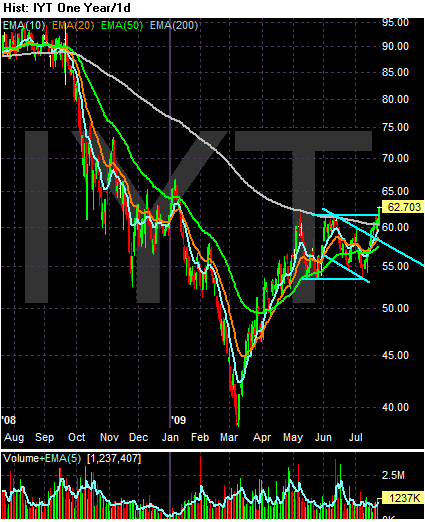
I look at the following charts and I see a rally. Indexes are above 200 day EMAs, prices are moving higher, EMAs are rising, technical resistance levels are being breached. Simply put, these charts look good. I'm going to delve deeper into them over the weekend to see where the problems might be. But, on the surface these are impressive.
Click for a larger image.
Also -- if you see something I don't, please chime in.


