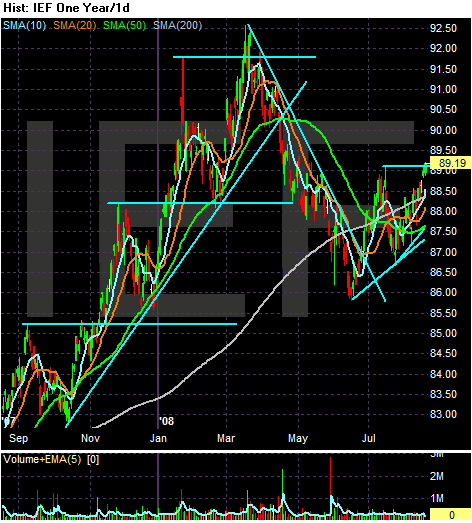
On the year long chart the credit crunch rally is very clear. It started in October of last year and continued until March 2008. Notice that prices continually made new highs, breaking through previous resistance and then consolidating gains. The 50 day SMA provided strong technical support for this rally.
In March of this year, the Federal Reserve brokered and backstopped the Bear Stearns buy-out. This sent a signal to the market that the federal government was in bail-out mode. Therefore traders sold treasuries and bought stocks.
Since the end of June, we've seen the market consolidate in a triangle pattern. Also notice this move occurred right around the 200 day SMA -- the line between bull and bear markets.

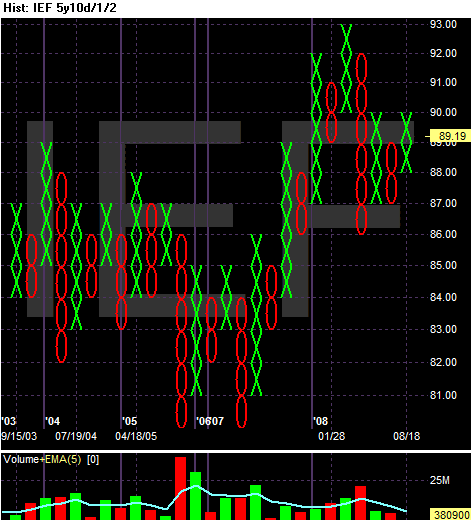
The P&F chart shows two points very clearly.
1.) The rally that took place last year, and
2.) The triangle consolidation pattern that is currently occurring.

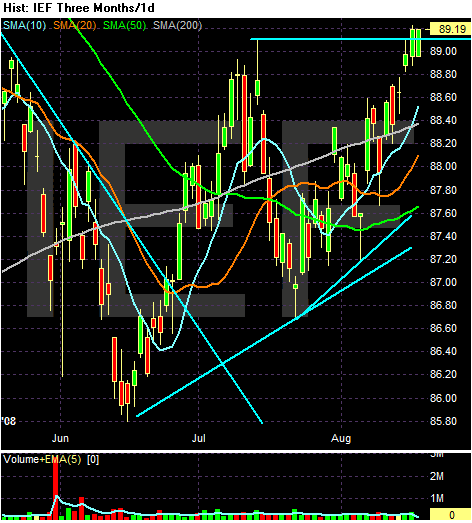
On the three month chart, notice the following:
-- Price have broken through the top line of resistance in the triangle consolidation pattern that started in mid-June
-- The SMAs are lining up in a very bullish configuration: the shorter SMAs are above the longer SMAs, all the SMAs are moving higher
-- Prices are above all the SMAs
-- Prices are above the 200 day SMA
-- Refer back to the year-long chart above. Notice the 200 day SMA never headed lower.
Bottom line: this chart is technically lining up in a very bullish way.