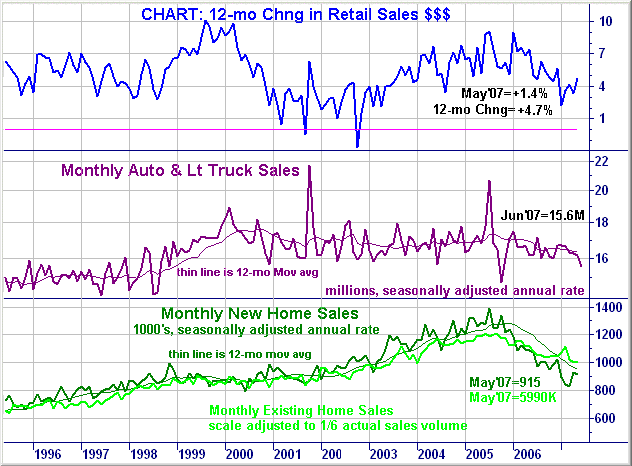
1.) The YOY change in retail sales has dropped since the beginning of 2006. However, it has picked-up since the beginning of 2007, possibly representing a reversal of the downward trend.
2.) New and existing home sales have been dropping since mid-2005.
3.) Car sales have consistently fluctuated between roughly 16 million/year and 17.75 million a year since 2001. However, the annual sales pace has consistently declined since the beginning of the year.
