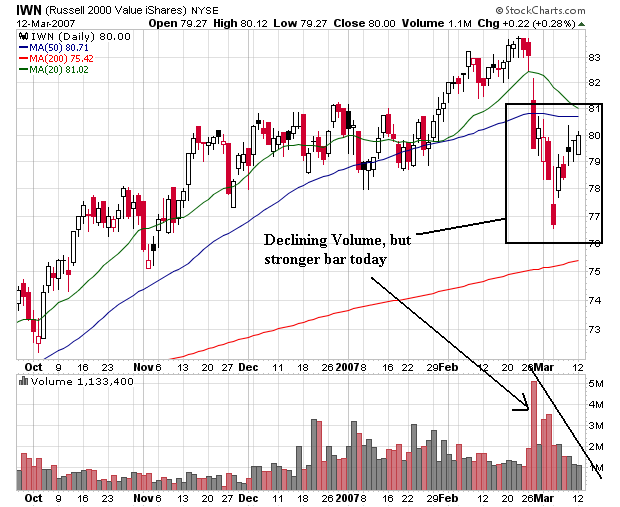


All three averages are settling down in terms of volume, which has declined gradually from the selling peak a few weeks ago.
Notice all three averages have a somewhat weaker rally. All averages contain weaker candle bars -- bars with shorter bodies and longer shadows. Also note the rallies occurred on declining volume -- a bearish sign. However, because the markets are coming off of very high volume days, the declining volume may not have as strong a bearish implication.
With the IWNs note today's strong bar. There is no lower shadow and the market closed near its high. This is called a bullish engulfing pattern, and it is considered a bullish signal. While the volume total does not confirm it, the size of today's body may indicate traders are looking at small caps again.
It still looks to me like that averages are looking for direction. While all three are technically in an uptrend, the inner-dynamics of the uptrend just aren't that strong.
As with all TA -- the markets will make an ass of you whenever and wherever possible.