Saturday, April 12, 2025

Weekly Indicators for April 7 - 11 at Seeking Alpha


 - by New Deal democrat


My “Weekly Indicators” post is up at Seeking Alpha.

In this time of exogenous shock to the economy caused by the whims of one man, it is especially important to keep laser-focused on the hard data.

And the first hard data that will tell you what is happening is the high frequency data.

What I already wrote about this week is that the consumer spending data is holding up. So did jobless claims. But despite the big whipsaw in the stock and bond markets, there has been other short leading data that has suggested some deterioration has started.

As usual, clicking over and reading will bring you up to the virtual moment as to the state of the economy, and reward me a little bit for collating and presenting it to you in an organized fashion.

Friday, April 11, 2025

Real hourly and aggregate pay for nonsupervisory workers increased in March


 - by New Deal democrat


 With yesterday’s CPI report, we can update two important measures of ordinary American workers’ well-being, that also serve as short leading indicators: real average hourly earnings and real aggregate nonsupervisory payrolls. 


There have been two months since the pandemic lockdowns five years ago, including last June, where there were very slight decreases, but these rounded to unchanged, but yesterday’s -0.06% decline which rounded to -0.1% was reported that consumer prices went down significantly since April 2020.

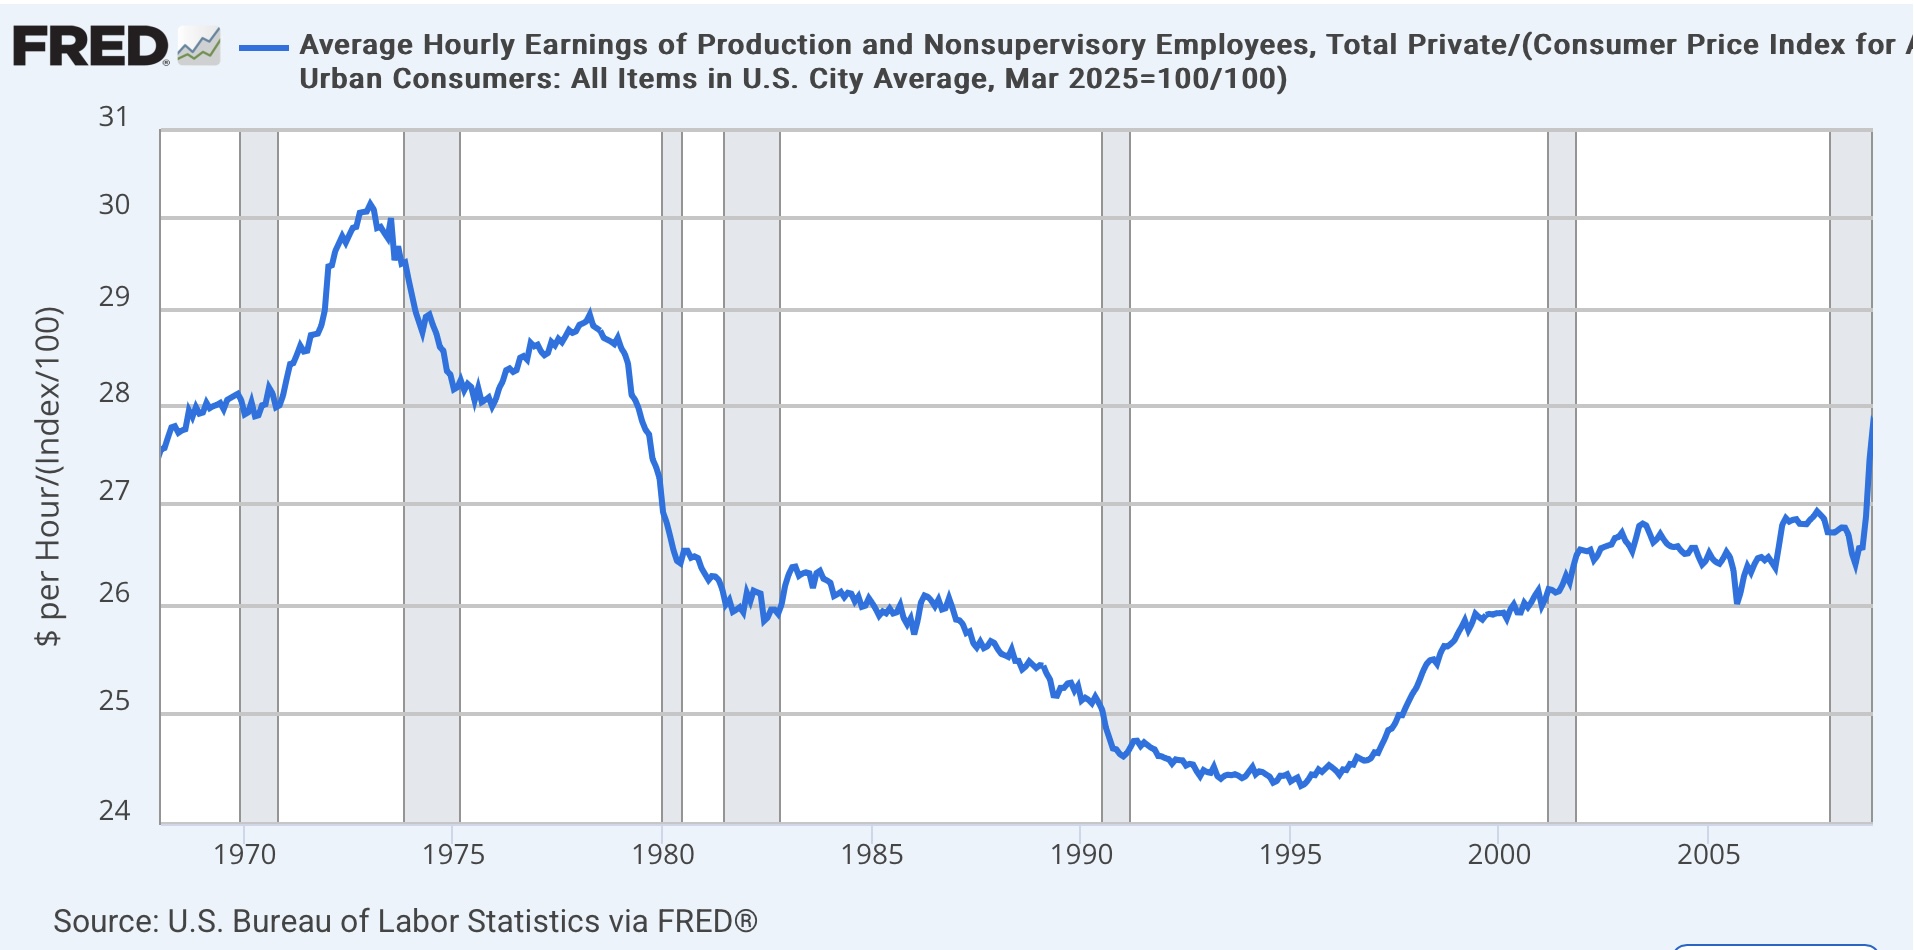
Reported average hourly earnings increased 0.2% nominally in last week’s jobs report, but that also reflected a rounding up from 0.16%. So real average hourly earnings increased 0.2% to the highest ever level except for April and May 2020 - and recall that those months were heavily distorted by the layoffs of millions of low-wage service workers:


With the exception of the pandemic itself, in all cases in the past 60 years, recessions have not occurred until real average hourly wages have either turned down or at least stalled (1970 and 2001):


An even better forecasting metric is real aggregate nonsupervisory payrolls. This tells us how much buying power ordinary American workers have in the aggregate. So long as this keeps increasing, the economy is powered by the added ability to spend. It is only when this stops that a downturn has begun.

In last week’s jobs report, nominally this increased 0.86%, rounded up to 0.9%. Again, due to rounding, the real figure is also 0.9%, which caused real aggregate payrolls to rise to another all-time high, 9.2% above their level just before the pandemic:


In all but one case in the past 60 years, real aggregate payrolls have turned down at least several months before the onset of a recession. In the case of 1970, it was only one month:


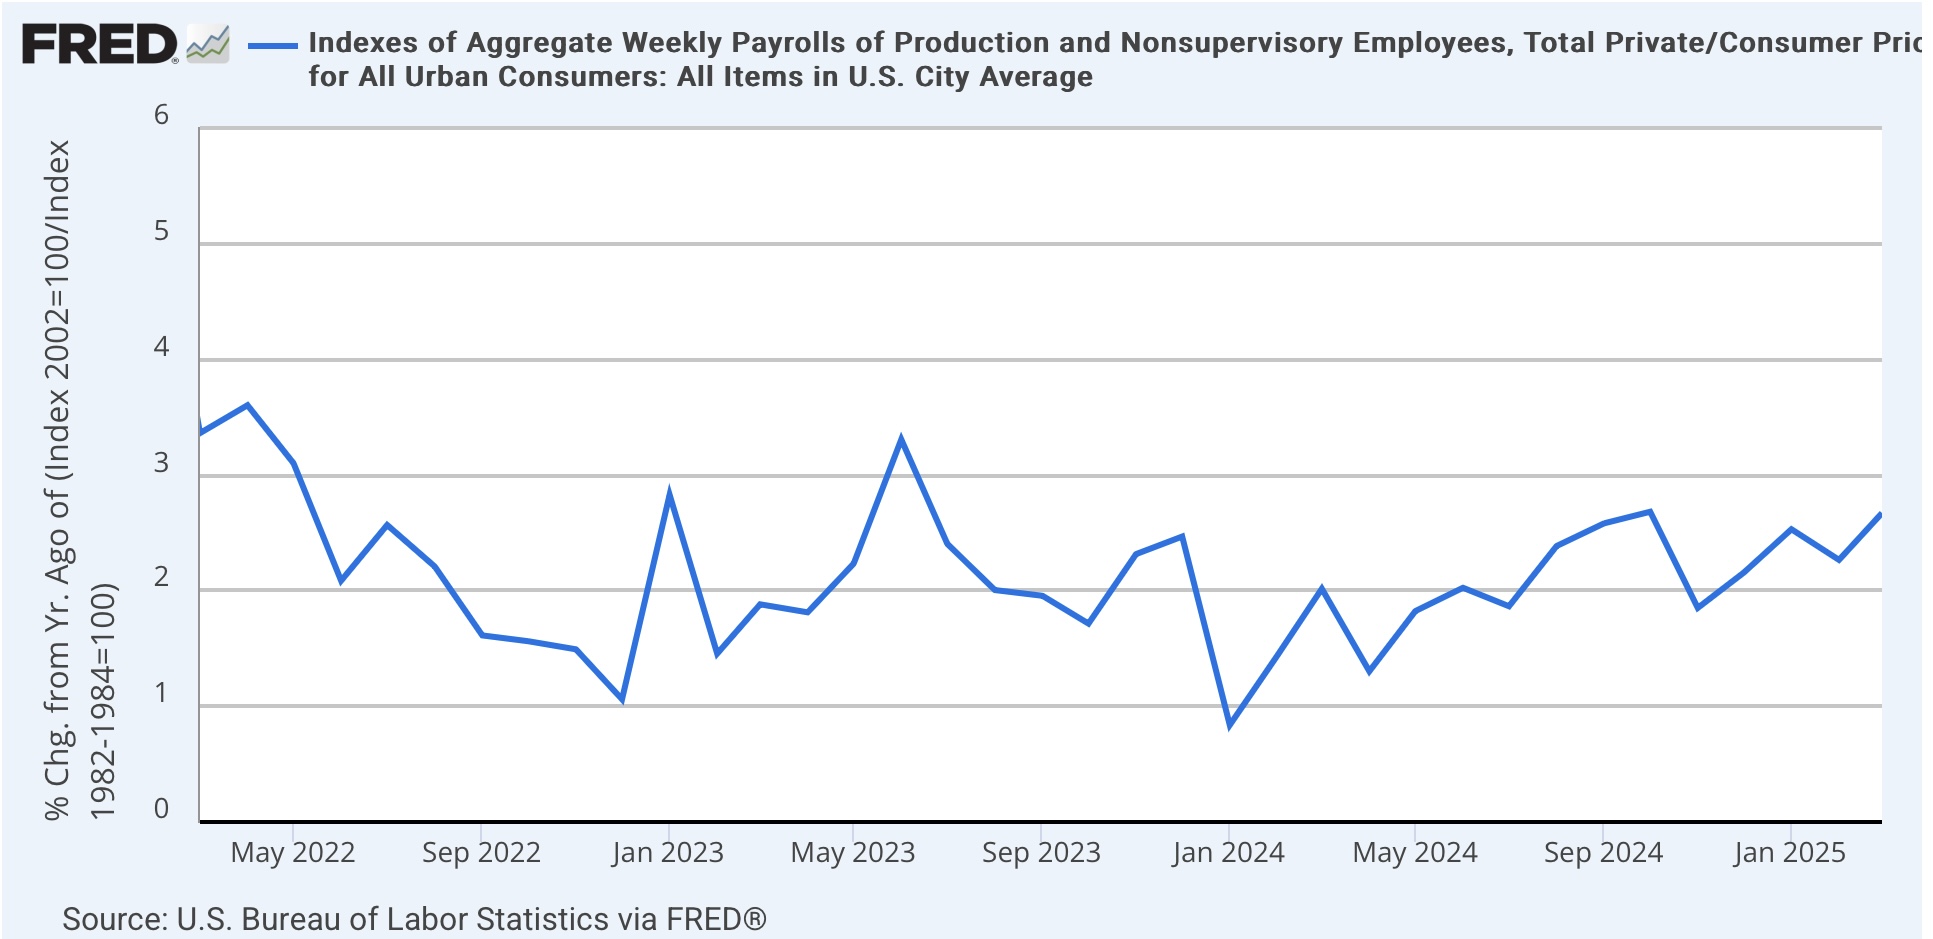
In all cases, the YoY% change in real aggregate nonsupervisory payrolls has deteriorated sharply before the onset of recessions, and turned negative within a month or two of the onset:


Currently these are higher by 2.7% YoY, and show no signs of deceleration - yet:


March is somewhat of the “Before Times,” since the Idiot King’s tariff madness is likely to upend everything, especially inflation. Speaking of which, this morning’s PPI, in which both commodities and final demand producer prices declined -0.4%, is probably about the last gasp of the Before Times as well:


FWIW, there has been no sign this week in any of the high frequency hard data of any sudden deterioration in consumer spending, or increase in layoffs. 

Thursday, April 10, 2025

March CPI: this is the report we have been waiting for


 - by New Deal democrat


In March, with the exception of the usual problem child of shelter, almost every other component of consumer prices was tame - except for meat and eggs. And even shelter continued to decelerate. If Jerome Powell hadn’t tied his wagon to the core CPI number that includes shelter, he could simply declare victory over inflation.


Let’s get to the almost all good graphs.

First, here are the headline (blue), core (red), and ex-shelter (gold) m/m numbers m/m for the past two years:


Only last May and June were comparably low.

And here they are YoY:


Headline prices *declined* -0.1% for the month, the lowest reading since the Covid lockdowns of 2020. Core inflation was 0.1%, the lowest since January 2021, and CPI less shelter also declined, by -0.2%, the lowest since March 2023. On a YoY basis, headline prices were up 2.4%, the lowest since February 2021. Core prices were up 2.8%, the lowest since November 2021, and CPI less shelter was up 1.5%, the lowest since last October.

Last month I noted that the February readings in shelter have typically been among the highest of the year, suggesting unresolved seasonality issues, and that certainly appeared to be the correct understanding, given this month’s retreat (m/m is light blue, right scale; YoY is dark blue):


On a monthly basis, shelter increased 0.3%, tied for the 2nd lowest monthly increase in the past 2.5 years. And on a YoY basis, at +4.2%, it was the lowest in over 3 years. 

Breaking shelter down further, rent increased 0.3% for the month, and owner’s equivalent rent increased 0.4%. Nevertheless rent was among the lowest monthly increases in the past 3.5 years, and although owners equivalent rent did jump, it was lower on a monthly basis than at any point between the beginning of 2022 and May of last year. When we look at the YoY % change, you can see that the downtrend is intact:


Both measures are at 3 year lows, at 4.4% and 4.0% respectively. Given the recent monthly readings for house prices, I continue to expect slow disinflation winding up somewhere around the 3.5% range within the next 12 months.

The big positive surprise was in even more lagging problem child, transportation services (mainly motor vehicle insurance and repairs), which declined -0.7% for the month! This is the lowest monthly reading since September 2021. On a YoY basis, it decelerated sharply to 3.1%, the best reading in 4 years:


This deceleration was driven by a decline in airfares (perhaps all those Canadians and other foreigners who no longer want to visit the US), and also a -0.8% decline in insurance, although that was still higher by 7.5% YoY. Maintenance and repair prices did continued to soar, up 0.8% for the month.

Further, the former problem children of both new and used vehicle prices appear to have nearly completed their normalization process. New car prices were up only 0.1% for the month and unchanged YoY, while used car prices reversed their February increase and declined -0.7% for the month, and are only up 0.6% YoY:


And the icing on the cake was that energy prices declined a sharp -2.4% for the month, and are down  -3.2% YoY:


In addition to vehicle insurance and repairs, the only other “problem children” were piped gas utilities, tobacco products — and meat and eggs (m/m light blue, right scale, vs. YoY dark blue):


In addition to egg prices, which are up 60%! YoY, beef and pork prices are also sharply higher.
 
Bottom line: with the continued exception of shelter, this is the consumer inflation report we have been waiting for, for about the past three years. With the exception of motor vehicle repairs, meat — and eggs — everything broke lower this month. And shelter, as expected, has continued its slow deceleration. This is an economy which *ought to* enjoy smooth sailing in the months ahead on the inflation front — so long as no Idiot King comes along to mess it all up.


Jobless claims continue to reflect slowly expanding economy


 - by New Deal democrat


Before I deal with this morning’s March CPI report, let’s first update jobless claims.


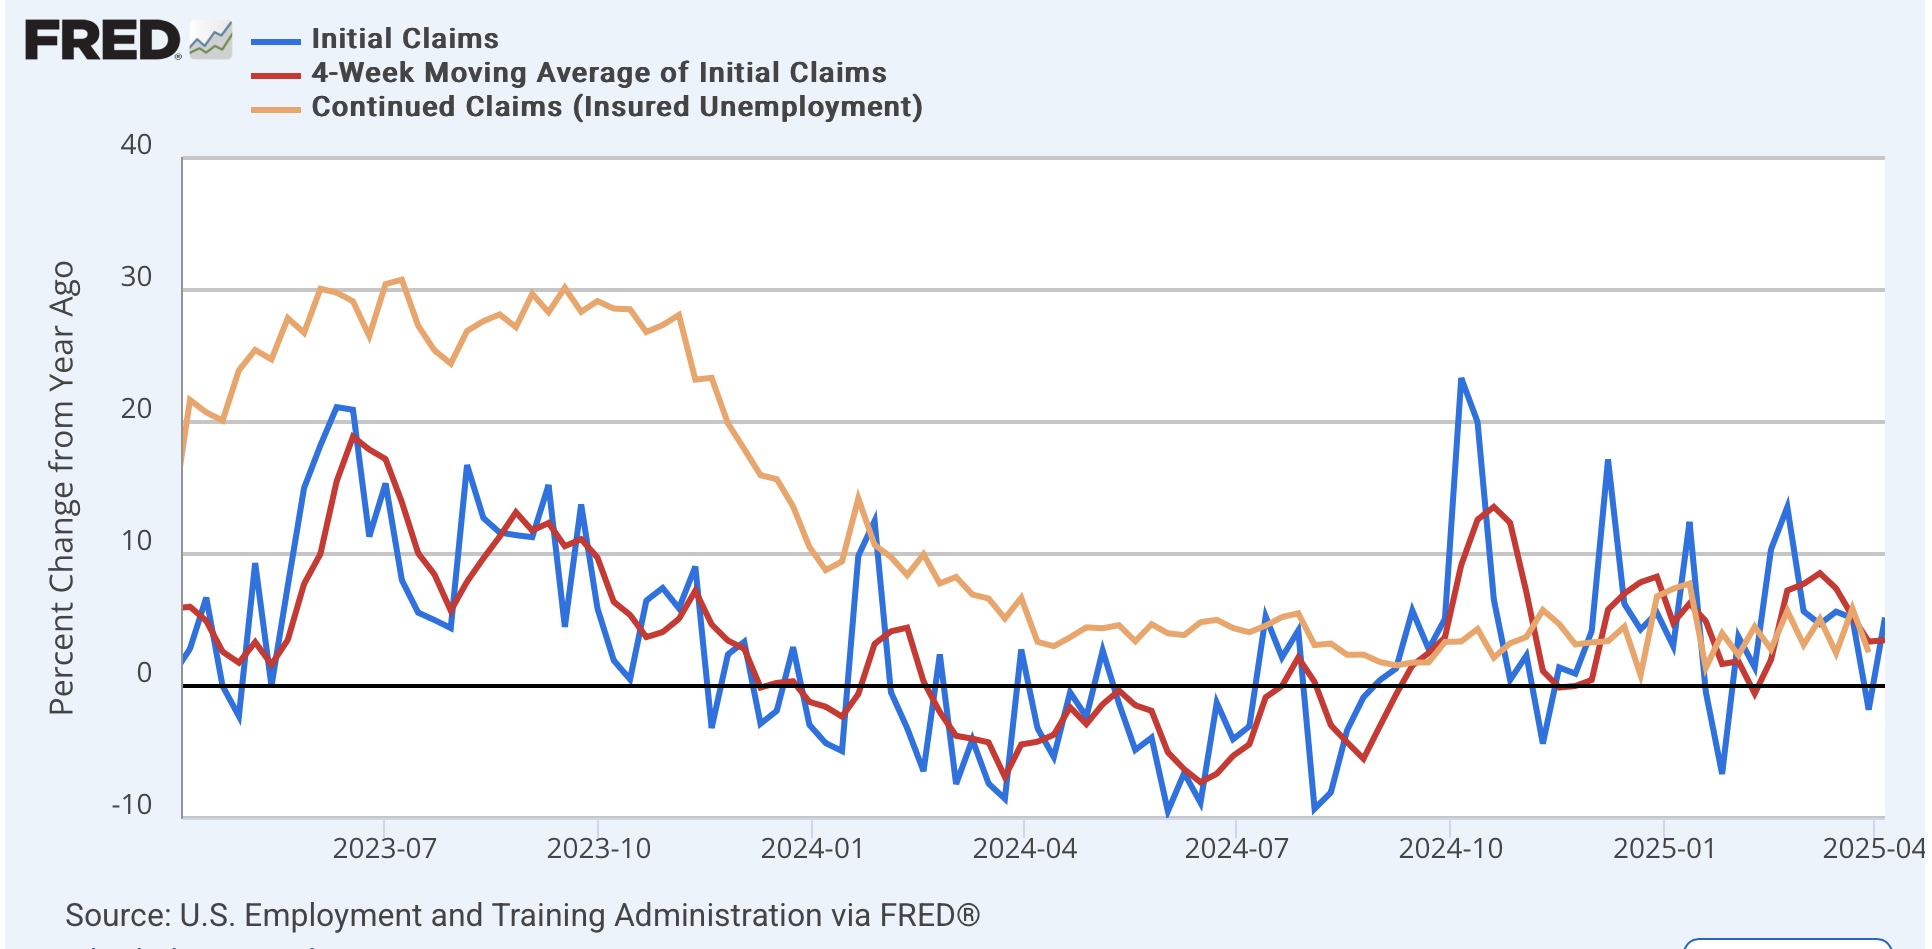
On a weekly basis, initial claims rose 4,000 to 223,000. The four week moving average also was at 223,000, unchanged from last week. And with the typical one week delay, continuing claims declined -43,000 to 1.850 million:


As per usual, the YoY% changes are more important for forecasting purposes. On that basis, initial claims were up 5.2%, the four week average up 3.5%, and continuing claims up 2.5%:


I’ll dispense with the usual graph comparing with the unemployment rate since we are so early in the month.

The bottom line for claims remains generally neutral, representing a slowly expanding economy in the immediate future (everything subject to what the Idiot King does in the meantime of course).

Finally, as a postscript let me just note on the daily data for purposes for tracking any tariff impact, restaurant reservations through April 6 were up 3% on a 7 day moving average basis.


Wednesday, April 9, 2025

The “Major Questions Doctrine” and the T—-p tariffs


 -by New Deal democrat


The financial market thrill ride continues on. I considered writing up a post on bond yields this morning, but who knows where they will be at the close of markets this afternoon?!?

So let me point out that the Roberts Supreme Court has created a legal doctrine under which the T—-p tariffs are almost certainly void as an invalid excercise of Executive power: to wit, the “Major Questions Doctrine.”

The very simple gist of the doctrine is that the Executive may not undertake any major changes without an explicit delegation of that specific type of major change. An implicit delegation, even one in the text of legislation, is not enough. The Executive must go back to Congress to see if they *really* meant what they apparently said. Thus for example Joe Biden’s cancellation of student loan debt was invalid, even though the Congressional enabling statute said that the President could “waive or modify” the terms of that debt. “No, not that much!” the Supreme Court said. If Congress wanted to cede that sweeping a power, Biden had to go back to Congress and get Congress to explicitly say so. 

More charitably it can be said to restrain federal agencies from asserting highly consequential power beyond what Congress could reasonably be understood to have granted. And more broadly that statutes must not be interpreted as delegating power to decide major questions unless the text clearly grants such power.

By way of a iittle more background, here is a basic primer on the history of the “Major Questions Doctrine.” [Note: much of the following is a summarization or cribbing from the “Constitution Annotated” website].

Article I, Section 1 of the Constitution says, “All legislative powers shall be vested in a Congress of the United States ….” Section 8 further provides that Congress has the power “To make all Laws which shall be necessary and proper for carrying into Execution the foregoing Powers,” one of which, explicitly in Section 8 is, “To lay and collect Taxes, Duties, Imposts and Excises.”

The Supreme Court has observed that this “Necessary and Proper Clause” authorizes Congress to establish federal offices.4 Congress accordingly enjoys broad authority to create government offices to carry out various statutory functions and directives. The legislature may establish government offices not expressly mentioned in the Constitution in order to carry out its enumerated powers.

But the power is not unlimited. In 1935, Chief Justice Charles Evans Hughes, on behalf of the Court, declared that Congress is not permitted to abdicate or to transfer to others the essential legislative functions with which it is thus vested. This principle is the basis of the nondelegation doctrine that serves as an important, though seldom used, limit on who may exercise legislative power and the extent to which legislative power may be delegated. 

The “Major Questions Doctrine” was first formulated by the Supreme Court in the 2002 case of FDA v. Brown and Williamson Tobacco Corp., in which they said: "[W]e must be guided to a degree by common sense as to the manner in which Congress is likely to delegate a policy decision of such economic and political magnitude to an administrative agency."

The doctrine was first made explicit by Chief Justice Roberts in West Virginia v. EPA in 2022, where he wrote: “[I]n certain extraordinary cases, both separation of powers principles and a practical understanding of legislative intent make us "reluctant to read into ambiguous statutory text" the delegation claimed to be lurking there…. To convince us otherwise, something more than a merely plausible textual basis for the agency action is necessary. The agency instead must point to "clear congressional authorization" for the power it claims; an further that “a decision of magnitude and consequence rests with Congress itself, or an agency acting pursuant to a clear delegation from that representative body

And as pointed out above, in Biden v. Nebraska, in 2023, the Court held that Congress did not authorize the Department of Education to institute a sweeping student loan forgiveness program under the HEROES Act of 2003, despite the explicit language in the statute allowing the Deparment to “waive or modify” the terms of the loans. Which looks pretty darn explicit.

So let’s turn to the issue of tariffs. Traditionally courts have shown great deference to Presidents using delegated authority to regulate specific tariffs, and also where there are national security implications. But T—-p’s actions last week arose under the International Emergency Economic Powers Act of 1977, which gave the President authority "to deal with an unusual and extraordinary threat, which has its source in whole or substantial part outside the United States, to the national security, foreign policy, or economy of the United States, if the President declares a national emergency with respect to such threat.

It’s pretty clear that the main driver of the tariff announcements last week were to deal with the decades’-long and chronic issue of the US’s trade deficits. There is absolutely nothing that has happened in the past year that would transform this chronic issue - that Congress has never significantly legislated about - into an “emergency.”

Further, the tariff pronouncements are such that they have almost instantaneously upended the decades’ long integration of global markets.

Was there ever a “clear congressional authorization" for the President to completely reorder the global trade relationships of the United States? Does it sound like “a decision of a magnitude and consequence [that] rests with Congress itself, or an agency acting pursuant to a clear delegation from that representative body?

Let me put it this way: is there the slightest doubt that if President Obama or Biden had done this that the Roberts Court would not cite the Major Questions Doctrine to stop it?

The bottom line is that it is not just Democrats in opposition who are horrified by T—-p’s tariffs. It is the core GOP constituencies of Wall Stree and corporate America who are screaming the loudest.

The Roberts Court has made a thoroughgoing record of being partisan. But in this case the disagreement is not between the Left and Right, but between two core constituencies of the Roberts Court itself. And the economic damage to the United States might prove catastrophic, and quite quickly too.

Under those circumstances the Roberts Court might well be receptive to enjoining the T—-p tariffs under the “Major Questions Doctrine.”

Tuesday, April 8, 2025

Daily T—-p tariff recession watch: no evidence of hard data deterioration to start


 - by New Deal democrat


Are the T—-p tariffs quickly putting the US into a recession? 


As I wrote yesterday, there are two daily and two weekly indicators, as well as five regional Fed broad economic reports released during the month, that should give us a quick heads-up.
Today’s editions is something of a baseline, since even the daily reports ended no later than April 6. Let’s take a look.

First, Redbook retail sales last week jumped to a high of 7.2% YoY, the 2nd highest comparison in the entire past year. The four week average was 5.7%, about average for the past 10 months:


Next, restaurant reservations also continue to be healthy, up 2% YoY during the past week, within the average range of YoY comparisons this year.

Next, if there are layoffs, tax withholding begins to suffer. It also suffers when stock prices decline such that supervisors and executives are unable to cash in stock options. Matt Trivisonno of the Daily Jobs Update has a graph (delayed by 3 months for non-subscribers) comparing the entire past 365 days of payments vs. the 365 previous days. As you can see, by early this year it was up about 6% YoY:


I have crunched the numbers through last Friday’s report, the latest date available, and currently the 365 day YoY comparison is up 7.1%.

I also looked at the 13 week and 4 week averages YoY. As of last Friday’s report, they were higher by 7.4% and 8.3%, respectively.

So again, no sign of a consumer pullback at this point.

Finally, even though initial jobless claims won’t be reported until Thursday, economist Aaron Sojourner pioneered a study looking at google searches for “file for unemployment”. He found no spike through the end of last week:


On the other hand, Guy Berger found a substantial YoY% increase:


I am a little leery of this, because it should correspond to the YoY% change in initial claims. The search history shows a bottom in August of last year, and a sharp acceleration in the YoY comparison starting in February, but initial claims do not show any YoY deterioration since last autumn:


The only explanation that may fit is if Federal employees who either had been, or were in fear of, being DOGE’d, searched on google, even though they have received severance benefits.

So the conclusion as I begin this watch is that there is no evidence of a significant downshift in any of the high frequency hard data at this point.

Monday, April 7, 2025

Is a T—-p Tariff recession starting? My plan for real-time daily, weekly, and intramonth updates


 - by New Deal democrat


Normally on the Monday after the employment report, I do a deeper dig into its details. But today that seems a little quaint, sort of like rhapsodizing about the Roaring 20’s the week after the great Crash of 1929.


Lots of other people, e.g., Bill McBride, have looked into their crystal balls and seen a recession coming, or at least heightened risk. No doubt that is true. But I am a data nerd, and my mission is to pay attention to what the actual hard data says.

Over the weekend on Seeking Alpha I was asked if I could “reassure” people that the economic indicators - even high frequency ones - would telegraph a recession before it began. My response was that with exogenous events, in particular an event caused by a single human actor, nothing could be “assured.” For example, I wrote that “Given [T—-p‘s] mercurial record, I would give not more than 50% odds that these tariffs will remain substantially in place for more than a month or two;” but that the weekly data like new jobless claims and retail spending, and even daily updated “hard” data such as withholding tax payments and restaurant reservations would give almost instantaneous warnings that producers and consumers had started to pull back.

So, in view of the fast moving events, my plan is to add a focus on two general sources of information.

First, I plan to include daily updates on tax payments and restaurant reservations, as well as updates on Tuesday as to weekly retail spending, in addition to the Thursday updates on jobless claims that I already do.

Secondly, the five regional Feds that issue monthly manufacturing reports before the month is over - New York, Philadelphia, Richmond, Kansas City, and Dallas - also issue similar updates about the services economy. I have not written about these before because they appear to be coincident indicators, and you know I focus on what is ahead, not what has just happened. But at least for this month, I plan on highlighting these as well, because they will be among the very first “hard” indications that consumption of services is taking a hit. The NY Fed will be the first report, on the 16th, followed by Philly and Richmond on the 22nd, Kansas City on the 25th, and Dallas on the 29th.

Between the above daily, weekly, and intramonth reports, we should have as close to a real-time report of the tariffs’ effects on the economy as possible.

——-
Edited to Add: I happen to think the Roberts Court has handed potential plaintiffs challenging the legality of these tariffs a theory that is a very potent weapon. I hope to explain that tomorrow.

Saturday, April 5, 2025

Weekly Indicators for April 1 - 5 at Seeking Alpha, + an update of the “quick and dirty” recession indicator


 - by New Deal democrat


My “Weekly Indicators” post is up at Seeking Alpha.

You may be surprised to learn that despite the 10%+ stock market crash on Thursday and Friday, my rating for the short leading indicator of the S&P 500 is still “neutral.” That’s because the market is extremely volatile. There was an all-time high only six weeks ago. And there is no guarantee whatsoever that T—-p won’t declare “VICTORY!” in a week or two, completely reverse this week’s tariffs, and the entire downturn in the market will reverse as well. My discipline says that if there have been both a 3 month high and a 3 month low within the past 3 months, that’s neutral - and it pays to stick with a discipline and not make exceptions.

In any event, you can get caught up to date on the state of all the indicators by clicking over and reading, and I will get rewarded with a little pocket change for the effort.

—-

And now, this week’s special update.

My “quick and dirty” recession indicator consists of two high frequency indicators: (1) a YoY downturn in the S&P 500; and (2) a 10%+ upturn in the four week average of initial jobless claims (inverted in the graph below).

Well, as of Friday, the S&P 500 is now down YoY, fulfilling the first criterion. Jobless claims are only 3.4% higher YoY, so even though that signal is weak, it isn’t negative yet:


If the tariffs do stay in place longer than a few weeks, it would not surprise me to see layoffs increase sharply, fulfilling the second criterion. But we’re not there yet.

BTW, the peak in YoY stock market performance - over 40% - was just before the November 5 elections. A more damning chart would be hard to find.


Friday, April 4, 2025

March jobs report: possibly the last good report of the expansion


 - by New Deal democrat


My question over the past year has been whether “decleration” would turn into “deterioration.” For a “soft landing,” deceleration would need to end, and the numbers stabilize, vs. continuing to deteriorate towards an actual downturn. With the stupefying economic moves by the new Administration, looking for hard data indicating the onset of a recession must also be a top concern.


To put it simply, this month was probably the last good employment report.

Below is my in depth synopsis.


HEADLINES:
  • 228,000 jobs added. Private sector jobs increased 209,000. Government jobs increased by 19,000. The three month average was an increase of +152,000, the lowest gain since last summer.
  • The pattern of downward revisions to previous months continued this month. January was revised downward by -14,000, and February uary was revised downward  by -34,000, for a net decrease of -48,000.
  • The alternate, and more volatile measure in the household report, increased by 201,000 jobs. On a YoY basis, this series increased 2,083,000 jobs, or an average of 174,000 monthly.
  • The U3 unemployment rate rose another 0.1% to 4.2%. Since the three month average is 4.1% vs. a low of 3.5% for the three month average in the past 12 months, or an increase of 0.6%, this means the “Sahm rule” has been triggered once again. 
  • The U6 underemployment rate declined -0.1%, to 7.9% from its 3+year high in February, which was its highest level since October 2021.
  • Further out on the spectrum, those who are not in the labor force but want a job now also rose another 22,000 to 5.915 million, the highest number since July 2021.

Leading employment indicators of a slowdown or recession

These are leading sectors for the economy overall, and help us gauge how much the post-pandemic employment boom is shading towards a downturn. This month they were almost all positive:
  • the average manufacturing workweek, one of the 10 components of the Index of Leading Indicators, rose 0.1 hours to 41.1 hours, This is the highest reading since May 2022, although it remains down -0.5 hours from its 2021 peak of 41.6 hours.
  • Manufacturing jobs increased 1,000. This series has been firmly in decline, although it *may* have leveled off in the past six months. The three month average is only slightly above last month’s, which was the lowest since mid year 2022.
  • Within that sector, motor vehicle manufacturing jobs fell -200.
  • Truck driving rebounded sharply, up 9,600.
  • Construction jobs increased another 13,000.
  • Residential construction jobs, which are even more leading, rose by amother 3,100 to another new post-pandemic high.
  • Goods producing jobs as a whole increased 12,000, and are at their highest level in 17 years! This is especially important, because these typically decline before any recession occurs. On a YoY% basis, these jobs are only up 0.3%, which is very anemic although not quite recessionary.
  • Temporary jobs, which have declined by over -550,000 since late 2022, declined by another -6,400. Nevertheless this month remained above their October 2024 low, so this may still suggest that the bottom in this metric is in. 
  • the number of people unemployed for 5 weeks or fewer rose another 25,000 to 2,362,000, vs. its 12 month high of 2,465,000 last August.

Wages of non-managerial workers
  • Average Hourly Earnings for Production and Nonsupervisory Personnel increased $.05, or +0.2%, to $30.96, for a YoY gain of +3.9%, the lowest YoY% gain since spring of 2021. On the other hand, Importantly, this continues to be well above the 2.8% YoY inflation rate as of last month.

Aggregate hours and wages: 
  • The index of aggregate hours worked for non-managerial workers rose a sharp 0.6% to a new record high. This measure is also up 1.1% YoY, right in line with its average for the past 12+ months. 
  • The index of aggregate payrolls for non-managerial workers also rose a sharp 0.9%, and is up 5.1% YoY, slightly above its average YoY rate in the past 18 months. This series should also increase compared with inflation, indicating a continuation in the ability of households to increase consumption.

Other significant data:
  • Professional and business employment increased 3,000. These tend to be well-paying jobs. This series has been down YoY since September 2023, and is now -0.2% YoY, which in the past 80+ years - until now - has almost *always* meant recession. On the other hand it has stabilized since last summer, vs. being down -0.9% YoY last April.
  • The employment population ratio was unchanged at 59.9%, vs. 61.1% in February 2020.
  • The Labor Force Participation Rate increased 0.1% to 62.5%, vs. 63.4% in February 2020.


SUMMARY

Although there were some negatives, this was generally a good, positive report. The large majority of leading employment sectors showed an increase in employment. Aggregate hours and payrolls also rose sharply.

The weak spots were the new near four year low in YoY average hourly earnings, and an increase in the unemployment rate. But that was driven primarily by an increase in the labor force rather than by a decrease in employment. The number of persons not in the labor force but who want a job also increased. As I have written a number of times in the past year, this is likely heavily influenced by the surge in immigration since the pandemic. Jobs, hours, and pay continue to increase at a decent clip; but the raw number of persons seeking employment has increased even more.

So this was a good, positive report. Possibly the last one before the impact of the tariff disaster.

Thursday, April 3, 2025

Economically weighted ISM manufacturing + services on the cusp on yellow caution flag


 - by New Deal democrat


Because manufacturing is much less important to the economy than in the decades before the Millennium, the economically weighted average of the ISM services index (75%) as well as manufacturing (25%), especially over a three month period, has been much more accurate since 2000.

In March the expansionary headline and new orders readings in the ISM services report decelerated sharply, to 50.8 and 50.4, respectively. As 50 is the dividing line between expansion and contraction, these are just barely expansionary. The three month average of each also declined from 53.4 to 52.8 and from 52.6 to 51.3 respectively.

Here is a graph of both the headline number (blue) and the new orders subindex (gray) for the past year, showing that they are both now in clear downtrends:


More concerning is that these are now compared with contractionary readings from the manufacturing index.

For March alone, the economically weighted headline average was 50.4, but the new orders weighted average fell into contraction at 49.1. The three month economically weighted average for the manufacturing and non-manufacturing indexes combined is 51.8 for the headline, and 50.9 for new orders.

Because it is only one month in the new orders component that has fallen below 50, we aren’t quite in the yellow caution zone yet. But if next month’s readings duplicate this month’s, the new orders component will give at very merit the yellow caution flag.

Possibly not the best time to intentionally start a trade war.


Jobless claims continue tame


 - by New Deal democrat


This week initial jobless claims declined -6,000 to 219,000. The four week moving average declined -1,250 to 223,000. With the typical one week delay, continuing claims rose 56,000 to 1.903 million, the highest number since 2021:


Since last year this week there was something of an outlier to the upside, by comparison YoY claims were down by -1.8%. The four week moving average remained higher by 3.4%, and continuing claims were also higher by 6.4%:


As I normally state, it is the YoY% comparison which is more important for forecasting purposes, and these number continue to indicate expansion, albeit at a slow pace.

It is important to note that if the Administration’s total disruption of the economy is going to have a major effect, we should start to see it in new jobless claims very soon. But so far, pretty much nada.

Finally, let’s take our final look at what this bodes for the unemployment rate. Here’s the YoY% view, with claims averaged monthly:


Here’s the look in absolute numbers:


With claims hovering at the 4-5% range in the past few months, this forecasts the unemployment rate tending towards 4.0% (i.e., 3.8%*1.045).

“Those who cannot see must feel:” global trade and tariffs edition


 - by New Deal democrat


Before I get to today’s data, let me make this brief note on the tariffs that were announced late yesterday and the instant reaction overnight. As to the effect on the US and global economy, I really don’t have anything useful to add to the general consensus of economists and other financial types; namely, this will function as a tax increase on consumers, who must pay more for the imported goods and services. I doubt very much there will be an expansion of domestic employment in “re-shored” industries to make up for that loss.


Aside from the fact that the entire process was slapdash, including tariffs on uninhabited islands and a joint US/UK military base, and that the formula boils down to a grade-schooler’s understanding of trade as zero-sum, more importantly the idea is being sold as a “re-ordering” of “global fair trade,” which like so many other moves made by this Administration, is illegal. Congress sets the terms of trade, including tariffs. Congress gave Presidents an “emergency” exception. T—-p invented a “fentanyl” emergency on the border, which he has now used for an entire global undoing of decades of policy - patently beyond his authority as President.

Which returns us to a fundamental Constitutional defect. The only remedies for such an overreach are either a Supreme Court decision which the Court decides it has to power to make, and which the President obeys; or Impeachment and Removal by the Congress, which requires a 2/3’s majority vote of the Senate - in other words, a dead letter.

As my old German grandmother used to say, “Those who cannot see must feel.” Americans in particular are about to have a very heavy round of “feeling.”


Wednesday, April 2, 2025

February JOLTS report: “soft landing” so far, but indications of further weakness ahead


- by New Deal democrat


 Along with all the other reports, yesterday the JOLTS survey was updated for February. This survey decomposes the employment market into openings, hires, quits, and layoffs, and so gives a more granular view. The question over the past year has been whether they best describe a “soft landing,” or “hard” one ending in recession.


Additionally, several components are slight leading indicators for jobless claims, unemployment and wage growth.

In February the news was mainly good, as most categories stabilized.

First, here are openings, hires, and quits all normed to 100 as of just before the pandemic:


Openings, which are “soft” data and have generally uptrended going all the way back to the turn of the Millennium, remain above their pre-pandemic levels, but this is not terribly significant. Both hires and quits fell below their pre-pandemic levels at the beginning of last year. But the far right end of the graph suggests stabilization, which is even more apparent when we zoom in on the past 12 months:


Openings are virtually unchanged from their level 10 months ago. Hires have been very stable since last July, and Quits have been stable since August. In fact on a 3 month average basis, both Hires and Openings have remained within a 1% range.

This is good news. It says “soft landing” (barring political own-goals in Washington like massive tariff wars, of course).

One item of concern in the report was layoffs and discharges, which increased to their highest level in almost two years excluding last September:


This is of a piece with the uptick in new jobless claims (red, right scale) we have seen in February and March, which in turn suggests there may be some upward pressure on the unemployment rate in the coming months.

Finally, here is the update on the quits rate (right scale) vs. the YoY% change in average hourly wages for nonsupervisory workers (red, left scale):


While the quits rate has been stable since last August, it did downshift from earlier in 2024. Average hourly wages have not yet reflected that downshift, but the likelihood is that they will follow, down to a YoY growth rate of about 3.6%-3.7% in the coming months.

To sum up, the coincident reporting in the JOLTS data indicates “soft landing” so far, while the short leading components suggest weaker employment data in the next few months.


Tuesday, April 1, 2025

February construction spending: nominal vs. real makes all the difference


 - by New Deal democrat


Since the turn of the Millennium, a downturn in manufacturing has not been enough to tip the economy into recession. There must also be a decline in construction as well.


This morning’s construction spending report for February painted a substantially different picture depending on whether the data was looked at nominally or in real inflation adjusted terms.

Nominally total construction spending (blue in the graph below) rose 0.7% in the month to yet another new all-time record; while residential spending (red, right scale) rose a sharp 1.3%, close to a 12 month high:


But when we deflate by the cost of construction materials, the picture is not so rosy:


So adjusted, total spending actually declined -0.1%, and residential spending rose 0.4%. 

The picture for the leading residential sector is that spending has been trending sideways (much like permits, starts, and sales) for the past year, while total construction is slowing. In fact in real terms it has not advanced in four months.

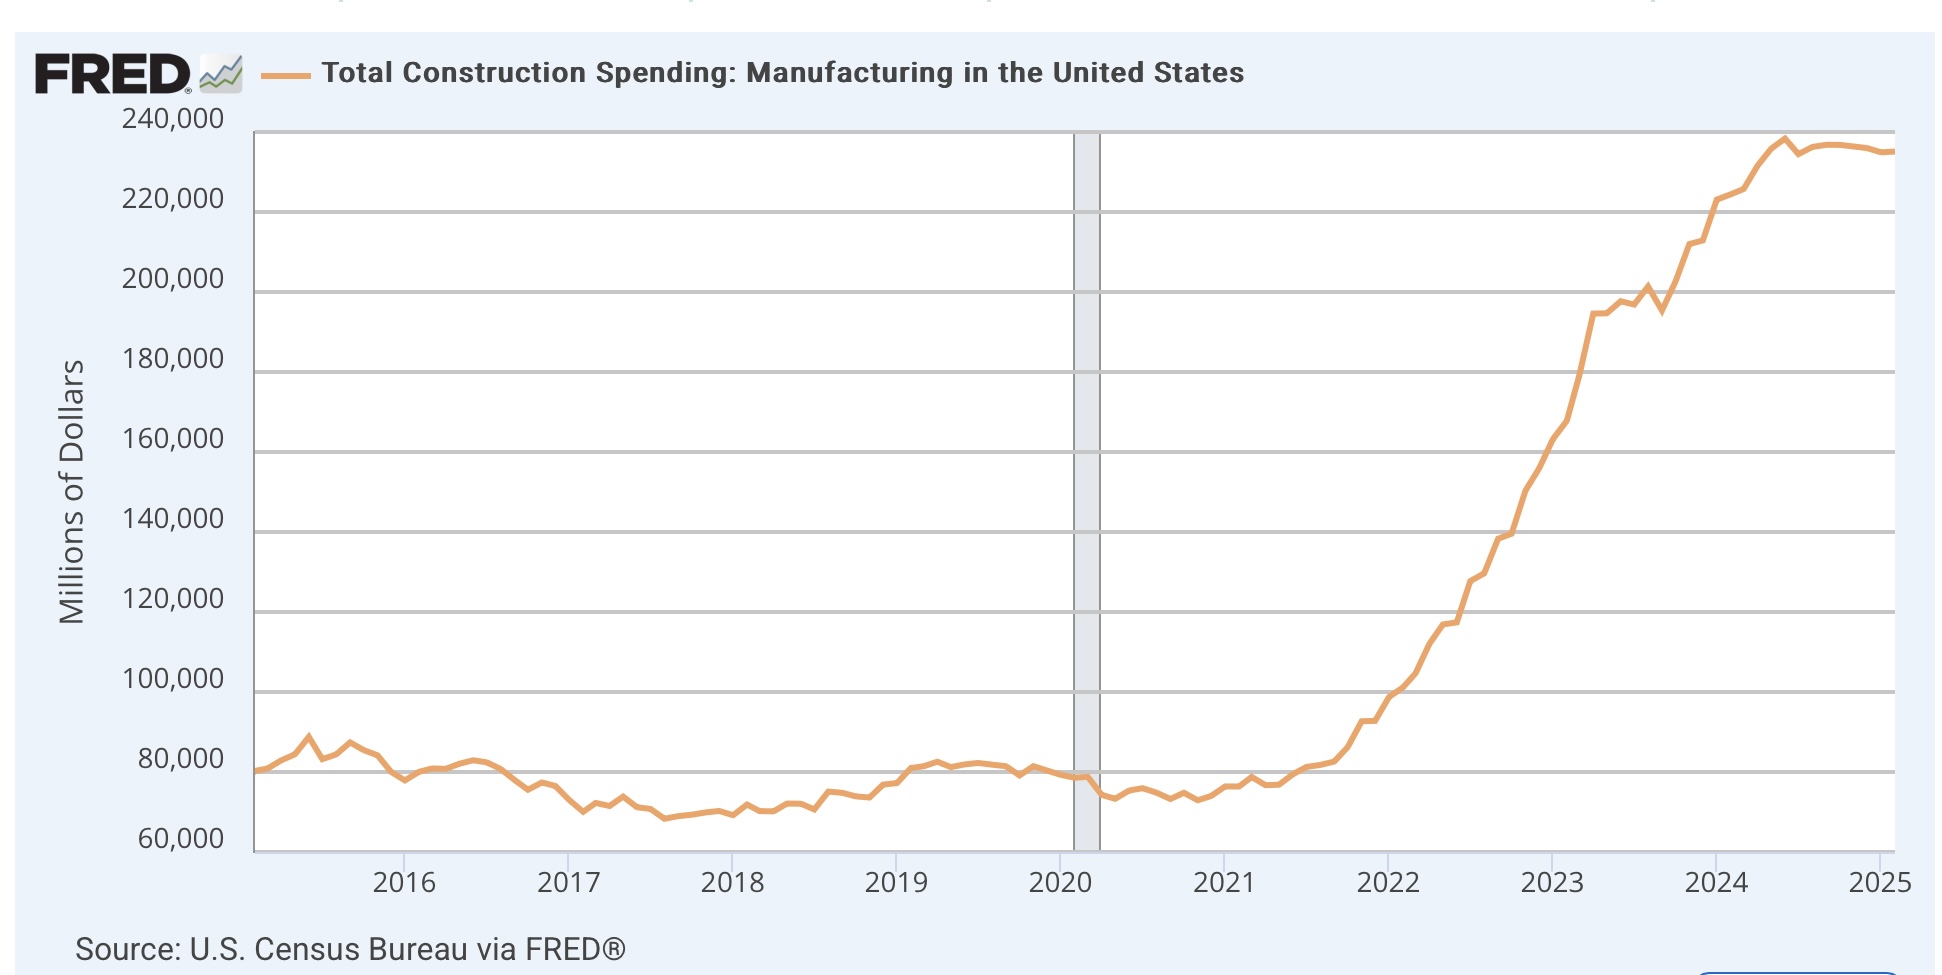
Finally, the boom in manufacturing construction has also ended:


The overall picture for the entire goods producing sector of the US economy from this morning’s ISM and construction spending reports is that both manufacturing and construction are almost right at the juncture between expansion and contraction.