Saturday, August 12, 2023

Weekly Indicators for August 7 - 11 at Seeking Alpha


 - by New Deal democrat

My Weekly Indicators post is up at Seeking Alpha.

For the moment we are in something of a holding pattern, in particular with the coincident indicators. Buoyed by the big downturn in commodity prices, and somnolence of consumer prices ex-fictitious shelter, the short leading indicators continue to be much more positive.

As usual, clicking over and reading will bring you up to the virtual economic moment. And while you are at it, I also updated my fundamentals-based “Consumer Nowcast” model, as to which this is the most important graph:


Both will reward me a little $$$ bit for my efforts.

Friday, August 11, 2023

July producer prices: economic tailwind weakens, but still in place


 - by New Deal democrat

Normally I don’t pay too much attention to the producer price index, but because the steep decline in producer prices has been such a boon to businesses, and a big tailwind for the economy as a whole, whether that continues or not is important.


And in July, the deflationary pulse generally continued. While final demand producer prices for goods edged up by 0.1%, intermediate stage prices for goods declined -0.7% and raw commodity prices declined -0.3%:


The YoY comparisons improved, because last July’s big initial decline (led by energy prices) rotated out of the comparisons:


Still, end state producer prices are down -2.5% YoY, intermediate stage by -7.8%, and raw commodities by -7.0%.

Bottom line: the tailwind is not as strong as before, but it is still in place.

Thursday, August 10, 2023

July CPI: almost everything except fictitious shelter costs are getting close to the Fed’s comfort range


 - by New Deal democrat

Gasoline prices and fictitious shelter prices are once again moving in opposite directions, in a direct reversal of what the situation had been in the past 12 months. During late 2022 into this year, energy prices came down sharply, while owners’ equivalent rent was increasing. Now energy prices are beginning to increase again, while fictitious shelter CPI finally catches up.


Here’s the closer look.

First, both headline and core CPI grew at a mild 0.2% pace in July. The former is only up 3.2% YoY (an increase from last month’s 3.0%), while the latter is up 4.7% YoY:


Headline inflation is really no longer a problem. But when we take out gas, and keep in shelter, it is still elevated.

Which brings us to shelter. Ex-shelter, CPI was unchanged last month, and is only up 1.0% YoY:


If we used actual monthly house price and rents, YoY CPI would probably be up only about 0.6%.

The fictitious owners’ equivalent rent increased 0.5% for the month, which is still better than the 0.7% and 0.8% it was increasing monthly late last year:


So let’s update OER (blue) with the FHFA (red) and Case-Shiller (gold) house price indexes:


Exactly as predicted, OER is following house prices down with roughly a one year lag. OER is up 7.7% YoY now, decelerating at roughly 0.2%/month. The big question is how quickly it will continue to decelerate. If it does so at the same pace as house prices did, it will take only about another 6-8 months to get back to the level of the Fed’s comfort zone. If it continues to decline at only 0.2%/month, it will take several years instead. I lean towards the former outcome, but we’ll see.

Another pocket of high inflation was food prices. This too continues to subside, up 0.2% for the month and 4.9% YoY:


At its current pace of YoY decline, it will be in the Fed’s comfort zone in about 3 more months.

Next, new and used car prices have also been a major driver of inflation. Both declined in July, the former by -0.1% and the latter by -1.3%. They are up 3.5% and down -5.6, respectively, YoY:


Again, it will probably take about 3 more months of this for new vehicles to get into the Fed’s comfort zone.

But the situation is different when we look at “transportation services,” which includes things like insurance, vehicle rentals and repairs. This was up 0.3% for the month, but is still up 9.3% YoY:


I’m giving you the full 35 year history of this series to show how, even with recent steep declines, the YoY rate is still extremely high by historical standards. A lot of this has to do with owners hanging on to older model cars rather than get the full force of new vehicle sticker shock. Those older model vehicles need lots of repairs, and lots of repair shop employees to do the work. Hence a spike in demand feeding a continued spike in prices. Even at the current pace of decline, we’re probably still about 6 months away from a more “normal” rate of inflation here.

Finally, let me show you the Fed’s preferred metric these days, which is sticky price CPI. On a headline basis, this continues to decelerate slowly YoY, but note that the 1 month and 3 month annualized rates are very close to the Fed’s comfort zone:


The same is true of the core sticky price metric:


I strongly suspect the Fed will still do at least one more rate hike, although there may be a brief pause. But if current trends continue for 3 more months, then nearly everything except fictitious shelter is going to be close to or within their comfort zone. Which may or may not make a difference to them.

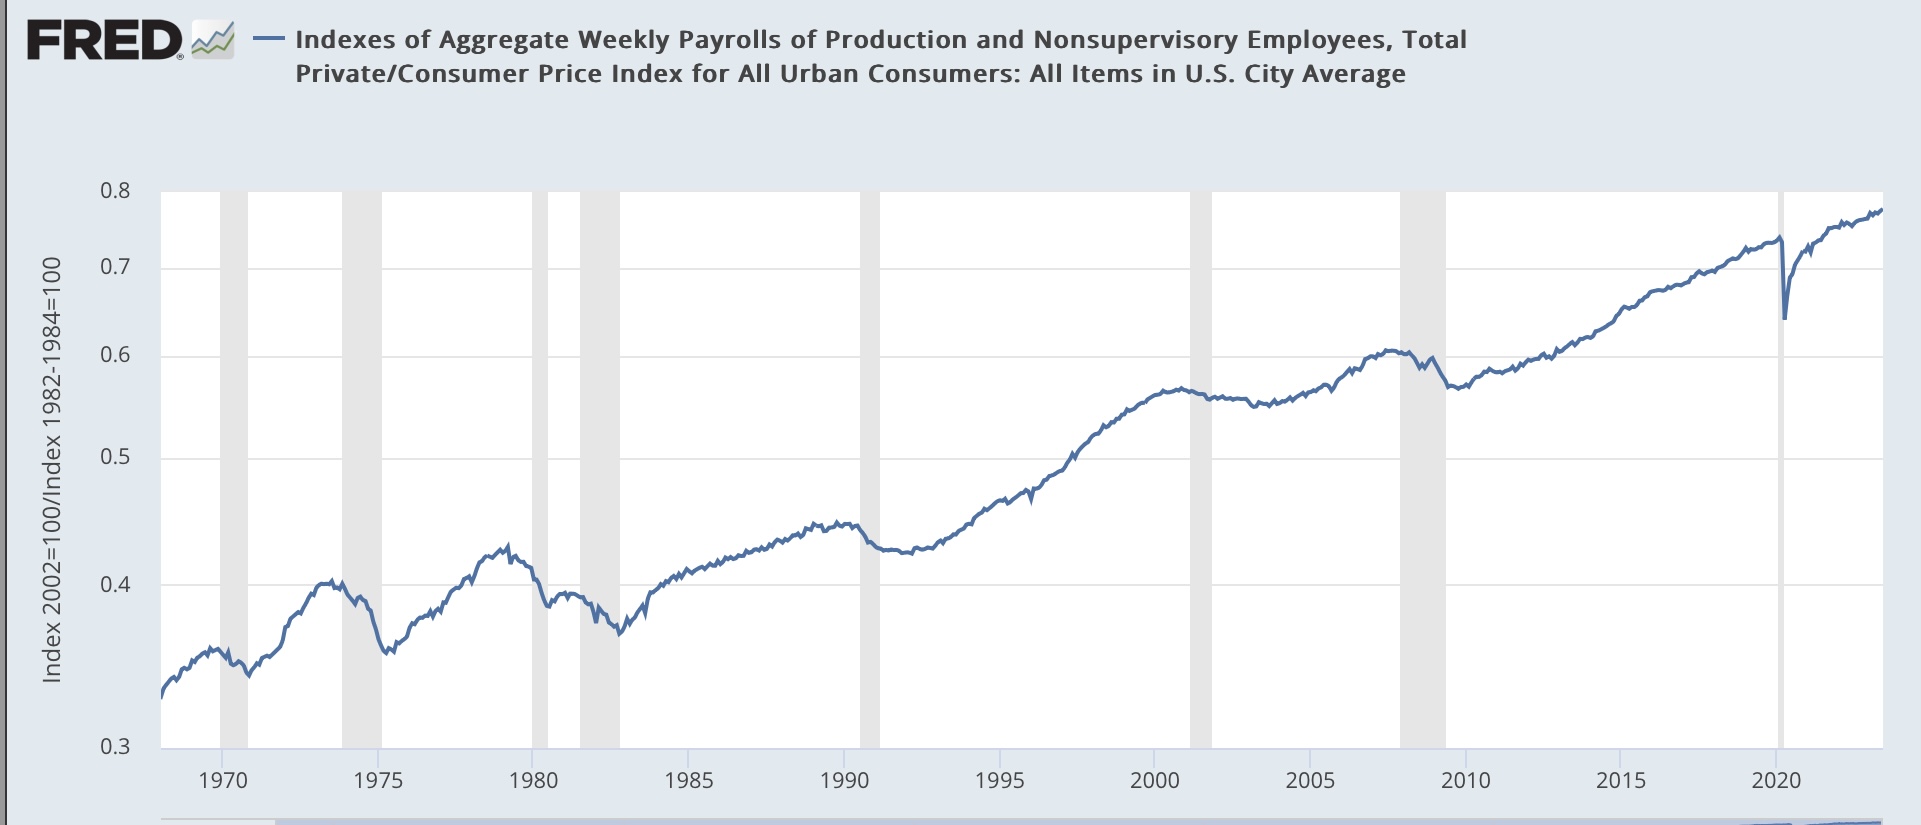
A second final comment is that if there is a mild re-acceleration of headline inflation, but that is coupled with continued deceleration in wage gains, then I would expect to begin to see signs of consumes feeling squeezed within a few months. Which would not be good in tandem with a Fed continuing to raise interest rates.


Initial jobless claims: a little soft, but continued expansion signaled


 - by New Deal democrat

I’ll put up an analysis of this morning’s CPI later. In the meantime, initial jobless claims rose 21,000 last week to 248,000. The more important 4 week moving average rose 2,750 to 231,000. With a one week delay, continuing claims declined -8,000 to 1.684 million:


On an absolute level, all of this remains very good.

The YoY% changes are more important for forecasting purposes. There, for the week initial claims are up 15.9% YoY. However, the 4 week moving average is only up 7.9% - far too low an increase to be consistent with any imminent recession. Continuing claims remain very elevated YoY, up 24.6%:


Remember, because YoY claims did not cross the 12.5% threshold for 2 full months, we re-set the clock. While claims suggest a slight increase in the unemployment rate on the order of 0.2%-0.3% in the next few months, that is not nearly enough to trigger the Sahm Rule.

In short, a little softness, but no recession signaled.

Wednesday, August 9, 2023

What to look for in tomorrow’s CPI and Friday’s PPI


 - by New Deal democrat


We’re still in the post-jobs report lull in economic news today. That will end tomorrow with initial jobless claims, and also CPI and PPI tomorrow and Friday respectively.


I always watch CPI, but I believe the PPI is uniquely important at present as well. To show you why, let me show you the YoY relationship between PPI and CPI for the past 75 years in two graphs below:


I’d like to focus your attention on those times when (1) both PPI and CPI were decelerating or declining YoY, and (2) PPI was decelerating or declining at a faster pace than CPI. 

Until recently, this relationship typically has occurred either in the latter part of recessions, or else early in recoveries just after the end of recessions. That’s because recessions kill demand, and since producer prices are more volatile than consumer prices, producer prices go down faster. Which lays the groundwork for the next expansion, as producers can produce goods more cheaply, enabling consumers to get a good deal - thus stimulating demand again.

But the relationship also has happened repeatedly in the middle of expansions in the past 40 years. Not always, but some of the time that has been not because of a decrease in demand, but rather an increase in the supply of commodities, chiefly but not necessarily limited to gas and oil. In those cases, consumers have just motored right through what otherwise would have looked like recessions.

Now cast your eyes to the far right. In the past year, commodity prices have declined almost 10% - one of the steepest declines ever. And that has *not* been because of a massive killing of demand, but rather because supply chain bottlenecks created by the pandemic have unspooled dramatically. 

At present the YoY% change in PPI prices are running -12.6% below that for the CPI, the highest in the entire 75 year period except for the very bottom of the Great Recession:


I am increasingly of the opinion that this amounts to a hurricane force tailwind behind the economy.

So tomorrow and Friday I will be looking to see if this trend continues, or if there are signs of a reversal. Tomorrow that may be evident in CPI ex-fictitious shelter, and on Friday we may see the first increase in PPI for raw commodities since January and only the second in the past year. If the downward trend continues, the tailwind is continuing. If the downward spiral breaks, then as the tailwind abates the lagged effects of Fed rate hikes will likely come to the fore.


Tuesday, August 8, 2023

Coronavirus special update: the annual summer wave has arrived


 - by New Deal democrat

As I wrote at the beginning of this year, I would only post Coronavirus updates if there appeared to be something significant happening. And there is.


There is a completely new alphabet soup of XBB subvariants that are competing with one another, and one of them, EG.5.1, has been surging in a number of countries worldwide and is now the fastest growing subvariant in the US as well:


Since the CDC and most States have stopped reporting, our only reasonably reliable metric for infections is Biobot’s waste surveillance, which shows that for the fourth summer in a row, from an all-time low in late June, particles in wastewater have more than doubled, to levels last seen back in April:


The increase is occurring across all four US Census regions:


Hospitalizations started increasing during the week of July 15, and are now about 50% higher than their recent nadir, although they are still lower than 10,000, which was their previous low in summer 2021 and spring 2022:


Deaths probably started rising from their all-time weekly low under 500 during the same week, although reporting is not final yet:


It’s too soon to tell how high the peak of this summer save will be, or when it will take place. But it is clear now that we are having yet another summer wave, aided no doubt not just be summer get-togethers, but also be an increase in indoor activities and the absence of any mitigation measures whatsoever. And also the facts that resistance due to prior infections and/or vaccinations are likely waning, and the next booster won’t be available until (apparently) sometime this autumn.

I have begun to temporarily revert to my prior precautions, mainly masking in any indoor public venues.

Monday, August 7, 2023

Scenes from the July employment report


 - by New Deal democrat

On Friday I noted that the July employment report was a perfectly good, solid one in absolute terms, but that almost all the leading components were soft and weakening, as I would expect to see near the final stages of an expansion.


Let’s take a look with some graphs today.

First, the good news.

The employment population ratio for the prime age working group, ages 25-54, at 80.9%, is the highest it has ever been except for the tech boom of the late 1990’s:


And the unemployment rate, at 3.5%, is only 0.1% higher than its lowest level during this expansion, and is tied with the lowest levels of 2019, which are the lowest in over 50 years:


Wages for non-managerial workers rose 0.5% for the month, and at an annual rate of 4.8%, which is 1.7% higher YoY than the last monthly read on inflation:


Wages rising at 1.7% over inflation is better than all but about 7 the last 60 years:


Finally, except for the pandemic it has *always* been the case that real, inflation-adjusted payrolls for workers have peaked a number of months before a recession. Unsurprisingly, this typically causes consumers in the aggregate to cut back spending, an immediate precursor to recessions:


In July in nominal terms aggregate payrolls rose 0.6%, or 6.4% YoY, a full 3.3% higher than inflation as last measured, to another all-time high.

In short, just about everybody who wants a job can find one, and the economy is functioning as close to completely full employment as it has been in over half a century, and those workers are earning wages at a level over inflation better than at almost 90% of all times in the past 60 years.

That is pretty darn good.

Now for the storm clouds out on the horizon.

Before industrial producers cut jobs, they cut back hours. And weekly hours for nonsupervisory workers in manufacturing have been cut back by almost 1 full hour, a decline typically seen shortly in advance of most past recessions:


In general manufacturing, residential construction, and temporary help jobs are among the first to turn down before a recession, as shown below for the past 50 years, or as long as records have been kept respectively (note 2 series are shown on right scale for easier comparison):


Now here is a close-up of the past year:


Temporary help jobs are down sharply, residential construction jobs down significantly, and manufacturing jobs are flat. The broader measure of goods-production jobs generally has increased only 0.4% since February, a declining rate typically seen late in expansions:


With the exception of factory hours and temporary help, none of these numbers are what I would expect right before a downturn starts. But definitely later in an expansion, on the order of 12-18 months before a recession.

Saturday, August 5, 2023

Weekly Indicators for July 31 - August 4, and long term forecast through H1 2024 at Seeking Alpha


 - by New Deal democrat


My Weekly Indicators post is up at Seeking Alpha.

No big changes in the data, but note that mortgage and other interest rates are up close to their peaks. This will operate to slow down growth in the housing market among other things.

As usual, clicking over and reading will bring you up to the virtual moment, and reward me a little bit for my efforts.

Also, earlier this week I did a comprehensive update of my long term forecast through the first half of 2024, which you can also find over there.

Friday, August 4, 2023

July jobs report: almost across the board deterioration in leading sectors


 - by New Deal democrat


My focus remains on whether jobs growth continues to decelerate, and whether the leading indicators, particularly manufacturing and construction jobs, as well as the unemployment rate (which leads going into recessions) have meaningfully deteriorated.

Almost all of these items did deteriorate in July.

Here’s my in depth synopsis.


HEADLINES:
  • 187,000 jobs added, which would be the weakest monthly number since December 2020, except that last month was revised down to 185,000.
  • Private sector jobs increased 172,000. Government jobs increased by 15,000
  • May was revised lower by -25,000 and June by -24,000, for a total of -110,000. The three month moving average decreased to 218,000, the lowest since January 2021.
  • The alternate, and more volatile measure in the household report rose by 268,000 jobs. The YoY% gain in this report is +1.9%.
  • The U3 unemployment rate declined another -0.1% to 3.5% (still above the 3.4% low last year). The civilian labor force, the denominator in the figure, rose slightly (by 152,000), while the numerator, the number of unemployed, declined by -116,000.
  • U6 underemployment rate declined -0.2% back to 6.7% 
  • Further out on the spectrum, those who are not in the labor force but want a job now declilned -142,000 to 5.247 million, still well above its post-pandemic low of 6.5% set last December.

Leading employment indicators of a slowdown or recession

These are leading sectors for the economy overall, and help us gauge how much the post-pandemic employment boom is shading towards a downturn.  These were almost all negative:
  • the average manufacturing workweek, one of the 10 components of the Index of Leading Indicators, declined -0.1 to 40.6, equal to its lows earlier this year and down -0.9 hours from February 2022 peak of 41.6 hours.
  • Manufacturing jobs declined by -2,000.
  • Within that sector, motor vehicle manufacturing jobs declined -2,200. 
  • Construction jobs increased by 19,000, in virtually every subsector except for residential construction.
  • Residential construction jobs, which are even more leading, declined by -5,500. It continues to appear likely that January was the peak for this sector.
  • Goods jobs as a whole rose 18,000. These should decline before any recession occurs. They remain up 1.7% YoY, which is a very good pace compared with most of the last 40 years.
  • Temporary jobs, which have generally been declining late last year, declined further, by -2,200.
  • the number of people unemployed for 5 weeks or less declined -54,000 to 2,004,000.

Wages of non-managerial workers
  • Average Hourly Earnings for Production and Nonsupervisory Personnel increased $.13, or +0.5%, to $28.96, a YoY gain of 4.8%, a 0.1% uptick from its lowest YoY gain since June of 2021 set one month ago.

Aggregate hours and wages: 
  • the index of aggregate hours worked for non-managerial workers increased 0.2%, and is up 1.6% YoY.
  •  the index of aggregate payrolls for non-managerial workers rose 0.6%, and increased 6.4% YoY, 0.2% higher than its 2+ year low set one month ago, and significantly above the inflation rate, meaning average working class families have more buying power.

Other significant data:
  • Leisure and hospitality jobs, which were the most hard-hit during the pandemic, rose only 17,000, -352,000, or -2.1% below their pre-pandemic peak.
  • Within the leisure and hospitality sector, food and drink establishments rose 13,400, but remain-64,400, or -0.5% below their pre-pandemic peak.
  • Professional and business employment declined -8,000. This is the first decline in this important sector since the end of the pandemic lockdowns. This series had already been decelerating, and is currently up  1.6%, its lowest YoY gain since March 2021.
  • The employment population ratio rose 0.1% to 60.4%, vs. 61.1% in February 2020.
  • The Labor Force Participation Rate was unchanged at 62.6%, vs. 63.4% in February 2020.


SUMMARY

This was a soft report (nevertheless quite positive by historical standards), which together with revisions to the last several months, marks another notch downward in deceleration. 

Almost all of the leading metrics were down. Employment in the entire goods sector has only shown gains due to transportation equipment manufacturing and non-residential construction. The comeback in leisure and hospitality jobs is much fainter. Professional and business jobs - one of the best paying sectors - may be rolling over. That revisions appear to be becoming routinely negative is also not a good sign.

The two bright spots in the report were un- and under-employment, which declined (contra the trend I expect them to take, based on the YoY increase in initial jobless claims) and wages. Average wage gains of 0.5% and aggregate wage gains of 0.6% in a month are very good for workers. Almost certainly they will exceed the monthly inflation rate once again. Because of these two things, this was absolutely not anything close to a recessionary report. 

But the slowdown almost across the board in leading sectors is akin to another compartment of a sinking ship flooding. Still, I do not think we get a recession until goods producing jobs as a whole decline. At their current pace of deceleration, that would be in about 9 months.

Thursday, August 3, 2023

Jobless claims: a good example of why my forecasting discipline demands a confirmed trend


 - by New Deal democrat

Initial jobless claims for the last week of July rose 6,000 to 227,000. The 4 week average decreased -5,500 to 228,250. Continuing claims, with a one week lag, rose 21,000 to 1.7 million:


The YoY% change is much more important for forecasting purposes. There, initial claims were up 4.1%, the 4 week average up 5.8%, and continuing claims up 25.9%:


The behavior of initial claims in the past number of weeks has been an important example of why my forecasting discipline demands 2 months of continued readings higher by 12.5% or more for a valid signal. Many times in the past 50+ years there have been spikes higher than 12.5% which dissipated within 2 months, and did not correlate with an oncoming recession. Only when the increased number is durable does it create a valid red flag recession warning.

Needless to say, we had a “close but no cigar” spike in June. The downturn in cliams in July resets the clock.

Finally, especially in view of tomorrow’s jobs report, let’s update what this means for the Sahm Rule (an increase of 0.5% from the low in the 3 month average of the unemployment rate means that a recession has begun). 

On a monthly basis, the YoY% change in new jobless claims is higher by 8.1%. Claims have been higher YoY ever since March, and - as has been the case for 50+ years - the unemployment rate (red) is following with a delay::


Note that the unemployment rate in the above graph is depicted as the % change in a percentage number. One year ago the unemployment rate was 3.5%.

A 10% increase in the unemployment rate takes us to 3.8% or 3.9% in the coming months, as best shown in the below graph of the same information in absolute terms:


That doesn’t necessarily mean that the unemployment rate will increase month over month tomorrow, but it tells us of the underlying trend in the naar future.

As I have for many months now, I will be looking for further evidence of deceleration in job gains, wage gains, as well as evidence of the above trend in the unemployment rate in tomorrow’s report.

Wednesday, August 2, 2023

June’s JOLTS report: slow progress towards a new equilibrium


 - by New Deal democrat


Yesterday’s JOLTS report for June captured a labor market that continues to move towards a new equilibrium, mainly via a gradual decline in job openings compared with labor availability. In other words, for the umpteenth time, “deceleration.”


Job openings and actual hires both declined to new 2+ year lows, and voluntary quits also declined to just above a 2+ year low:


For comparison, just before the pandemic, shown at far left, all three metrics were close to or at all time highs. 

Hires on a monthly basis are already back to pre-pandemic levels, and voluntary quits are about 80% back to pre-pandemic levels from their post-pandemic highs. Job openings, which unlike hires and quits, is a “soft” rather than a “hard” metric, because it can be inflated by, e.g., permanent or sham listings, have now retreated by slightly more than 50% to their pre-pandemic levels.

By contrast, layoffs and discharges bucked the trend of softness and declined to a 6 month low (blue):


Their pre-pandemic range was about 1700-1900. Their 1527 level in June was far below that.  Note that layoffs and discharges tend to lead initial jobless claims (red, right scale), which have also declined significantly in the past few weeks. 

Given all the other information we have, the downturn in layoffs looks like a counter-trend move compared with the past year.

For the past 18 months, I’ve likened the job market to a game of reverse musical chairs, where there are more chairs put out by potential employers than there are job applicants willing to fill them. June’s JOLTS report continued the trend we’ve seen for the past 15 months of a jobs market slowly returning towards a convergence of the number of chairs and players. It is likely that Friday’s employment report will show more of the same as well.

Tuesday, August 1, 2023

Manufacturing and construction give very mixed signals to start Second Half 2023 data


 - by New Deal democrat


As usual, the month’s data started out with the ISM manufacturing report for last month, and construction spending for the month before last. Additionally, I am going to take a look at motor vehicle production, because I think it is unusually important right now.


Manufacturing contracted for about the 10th month in a row in July, while the more leading new orders component has now contracted for more than a year. The index did rise 0.4 to 46.4, and new orders subindex rose 1.7 to 47.3:


Any reading below 50 indicates contraction, and ISM itself indicates that a reading of 48.7 in the total index is the breakeven point for the economy. So at face value, this continues to be very negative.

This month I also want to spotlight the price paid subindex, which has been the most negative of all, down as low as 40 near the end of last year. It remains the most negative now at 42.6, up 0.8 for the month:


Here is the question: how much of the continuing steep decline in commodity prices paid by manufacturers has to do with declining demand, and how much due to increasing supply, as pandemic bottlenecks unspool? Stay tuned.

Next, motor vehicle manufacturers used to report customer demand every month. Now they only report quarterly, which is not timely enough to be very interesting to me. But the DoT does report monthly with a one month delay. They reported June’s numbers at the end of last week, showing an increase to 15.7 M cars and light trucks bought on a seasonally adjusted annual basis, while heavy weight truck sales declined to 538,000 annualized:


Needless to say, motor vehicle production is a significant component of manufacturing. This tells us, importantly, that while most manufacturing is declining, per the ISM report, motor vehicle production is still ramping up as supply chain disruptions unspool. This is of a piece with the big increase in rail car deliveries I highlighted yesterday:


Heavy weight vehicle sales in particular are very cyclical, having turned down sharply well in advance of nearly every previous recession in the past 50 years. 

This is important because the ISM index, discussed above, is a diffusion index. It does not weight its various components. This tells us that a very large component, vehicle production, has been a strong counterweight to the decline in other manufacturing industries.

Turning finally to construction, nominally total construction spending rose 0.5% in June, while the more leading residential construction spending rose 0.9%:


But after adjusting for the cost of construction materials, while private residential construction spending did rise, it remains just off its worst post-pandemic levels:


The picture that emerges from this month’s opening data is very mixed. Manufacturing as a whole continues to decline, but against the weight of the very important expanding sector of motor vehicles; while construction continues to increase nominally, but the most leading component has rebounded only slightly in real inflation-adjusted terms.

Monday, July 31, 2023

Dow Theory says transportation and production of goods should move in tandem; what is its message now?


 - by New Deal democrat

Partly because mid year data is now being completed, and partly to re-examine my forecasts, I’ve been conducting a top-to-bottom re-check of my metrics.


One thing that seems very important is that, despite no real downturn in business at all, commodity prices have declined -9.6% in the past 12 months, one of the 4 steepest such declines in over 100 years:


The other three all occurred during recessions, two of which were the Great Depression and the Great Recession. In other words, this time the decline in commodity prices may have uniquely been about increasing supply (due to the unspooling of pandemic chokepoints) rather than decreasing demand. If so, that has been a much stronger tailwind for the economy than I have previously believed.

A similar positive is that measured both in terms of real average hourly wages and real aggregate payrolls, average American households have seen an increase in their real income over the past 12 months:


Similarly, this is an economic tailwind driven by decelerating consumer inflation (mainly about gas prices).

On the other hand, when it comes to both the production (blue, right scale) and sales of goods (red) (vs. services), there is little doubt that important sector of the economy has stagnated:


Over the weekend, I spent some time checking to see if measures of transportation of goods supported the data indicating stagnation in the goods sector. Here’s what I found.

The Cass Freight Index measures the YoY% change in the volume of freight moved by trucks. This index peaked in January and has been in decline ever since:


Intermodal rail traffic has been at recessionary level declines, while total carloads are essentially flat YoY:


Confirming a suspicion I have had elsewhere, the breakdown of rail traffic by sector by the AAR indicates that the biggest reason total carloads have not declined is the big increase in motor vehicle and parts loads, up about 12% YoY to date:


The Department of Transportation takes truck, rail, air, and water freight together and combines those into it Freight Transportation Index, which over time generally moves in tandem with industrial production:


It’s absolute level as of May indicates a significant decline since the end of last year:


Interestingly, note that all three of these truck, rail, and freight metrics also declined sharply in 2015, when an industrial recession did not punch through into any decline in consumer spending.

So, finally, here is the comparison of the Freight Transportation Index with real personal consumption for goods:


As in 2006-07 and 2015-16, the downturn in freight transportation has not been matched by any downturn in consumers’ purchases of goods. Almost certainly because of the steep deflation in producer prices and deceleration of consumer prices which, as shown in the second graph at the top, has increased the real spending power of consumers.