Saturday, February 4, 2023

Weekly Indicators for January 30 - February 3 at Seeking Alpha


 - by New Deal democrat


My Weekly Indicators post is up at Seeking Alpha.

While yesterday’s blockbuster jobs report dominated the monthly reports, several important weekly reports, notably the 4 week average of retail sales as measured by Redbook, and the temporary Staffing Index, weakened further to new post-pandemic lows. On the other hand, January tax withholding payments had the best showing in 3 months.

As usual, clickiing over and reading will bring you up to the virtual moment as to the state of the economy, and reward me with a $ or two for my efforts.

Friday, February 3, 2023

January jobs report: like a sports car at maximum acceleration


 - by New Deal democrat


My focus on this report was on whether manufacturing and construction jobs turned negative or not, and whether the deceleration apparent in job growth would continue.

Both of those were answered emphatically in the negative. Here’s my in depth synopsis.

HEADLINES:
  • 517,000 jobs added. Private sector jobs increased 443,000. Government jobs increased by 74,000. The three month moving average of growth increased sharply to 356,000, over a 100,000 jump.
  • The alternate, and more volatile measure in the household report had 2nd very positive month in a row, increasing by 894,000 jobs. The above household number factors into the unemployment and underemployment rates below.
  • U3 unemployment rate declined -0.1% to 3.4%.
  • U6 underemployment rate rose 0.1% to 6.6%.
Leading employment indicators of a slowdown or recession

These are leading sectors for the economy overall, and will help us gauge whether the strong rebound from the pandemic will continue.  These tilted to the negative:
  • the average manufacturing workweek, one of the 10 components of the Index of Leading Indicators, reversed December’s decline and increased +0.3 hours to 40.9, although it remains down -0.7 hours from its February peak last year of 41.6 hours.
  • Manufacturing jobs increased 17,000.
  • Construction jobs increased 25,000.
  • Residential construction jobs, which are even more leading, increased by only 100.
  • Temporary jobs, which for the last several months were declining, reversed course and rose by 25,900.
  • the number of people unemployed for 5 weeks or less declined -287,000 to 1,946,000, the lowest for the entire last 50 years except for 3 months in 2019.

Wages of non-managerial workers
  • Average Hourly Earnings for Production and Nonsupervisory Personnel increased $.06, or +0.2%, to $28.26, a YoY gain of 5.1%, the lowest gain since June 2021.

Aggregate hours and wages: 
  • the index of aggregate hours worked for non-managerial workers increased by a sharp1.0%, which is near a record for the past 60 years, and has only been exceeded by 3 months since 1995, all of which were earlier in the pandemic rebound.
  •  the index of aggregate payrolls for non-managerial workers also increased sharply by 1.3%, and rebounded to up 9.2% YoY. This metric had been decelerating nominally almost consistently for the prior 16 months.

Other significant data:
  • Leisure and hospitality jobs, which were the most hard-hit during the pandemic, rose 128,000, and have improved to -3.1% below their pre-pandemic peak.
  • Within the leisure and hospitality sector, food and drink establishments added 98,600 jobs, and are now only -1.3% below their pre-pandemic peak. 
  • Professional and business employment rose 82,000.
  • Full time jobs increased 278,000 in the household report.
  • Part time jobs increased 606,000 in the household report.
  • The number of job holders who were part time for economic reasons rose 172,000.
  • The Labor Force Participation Rate increased 0.1% to 62.4%, vs. 63.4% in February 2020.
  • Those not in the labor force at all, but who want a job now, increased 138,000 to 5.314 million, compared with 4.996 million in February 2020.
  • November was revised upward by 34,000, and December was also revised upward by 37,000, for a net increase of 71,000 jobs compared with previous reports. 

Finally, both the Establishment and Household report data for 2022 was revised this month. 

In the Household report, total population was adjusted upward by 954,000, and employment by 810,000. Other metrics had little or no change.

In the Establishment report, almost all months in 2022 were revised higher, with the exception of January, April and May. The net effect was an increase of 813,000 jobs in 2022, with relatively weaker growth in Q2, but stronger growth in the other 3 Quarters.

SUMMARY

This report could be likened to a sports car accelerating at maximum thrust. Almost everything was extremely positive. The only negative was the increase in involuntary part-time employment, which translated into a slight increase in the underemployment rate.

Everything else was positive, including all the leading indicators which I had been looking to weaken. In fact, some metrics were so positive that they make me think that some Holiday seasonality worked its way into the numbers. In particular, the 74,000 increase in government jobs was one of the strongest ever outside of census hiring every 10 years. Leisure and hospitality hiring was also among the strongest in the past 50 years outside of 2021, and food and drink hiring was the strongest ever aside from the immediate post-pandemic reopening through 2021.

Needless to say, in almost all sectors the pandemic losses have been completely recovered. As I indicated above, the universal sharp increases make me think that there was some unresolved seasonality in play. In particular, the return to bigger hiring in manufacturing contradicts every other measure of manufacturing in the past few months.

So I’ll celebrate this month’s report, but with a lingering suspicion that it is going to prove an outlier.

Thursday, February 2, 2023

JOLTS and jobless claims: the labor market remains a strong positive


 - by New Deal democrat


The message from the JOLTS report for December yesterday and jobless claims for last week today is that the labor market remains the strongest sector of the economy, with plenty of unfilled job openings, and almost no layoffs.


Initial jobless claims last week declined -3,000 to 183,000, and the 4 week moving average declined -5,750 to 191,750. Both of these are close to their multi-decade lows from last March. Continuing claims also declined -11,000 to 1,655,000:


There is no danger of any imminent recession signal so long as claims remain lower YoY, which has been the case for the past few weeks:


One caution: there was relatively little seasonal hiring in November and December for the Holidays, so fewer layoffs in January makes sense. This is probably the last week for that comparison.

Meanwhile, yesterday most of the metrics in the JOLTS report for December were positive, with an increase in job openings and hires, with a very small decline in quits:


Layoffs and discharges did increase to their highest level since March 2021 with the exception of one month:


Overall the JOLTS report showed a moderating, but still positive labor market, and the weekly jobless claims report shows that it is still the case that very few people are getting laid off.

In tomorrow’s jobs report for January, I’ll be looking for signs in manufacturing and construction employment of weakening in those leading sectors, as well as whether short term unemployment is rising in any significant way, and whether the trend of decelerating gains has continued.

Wednesday, February 1, 2023

January manufacturing at recessionary levels; December construction spending also declines


 - by New Deal democrat


The first data for the month of January is in, and with one exception, it is pretty bad.


The ISM manufacturing index declined -1.0 to 47.4. According to the ISM, 48 is the cutoff below which is more consistent with a recession. Even worse, the new orders subindex cratered, falling 2.6 to 42.5:


Going back 75 years, the *only* time that new orders have been this low and a recession did not occur was in the middle of the Korean War:


This highlights focusing on the change in manufacturing employment, which has yet to turn down, when nonfarm payrolls is reported this Friday.

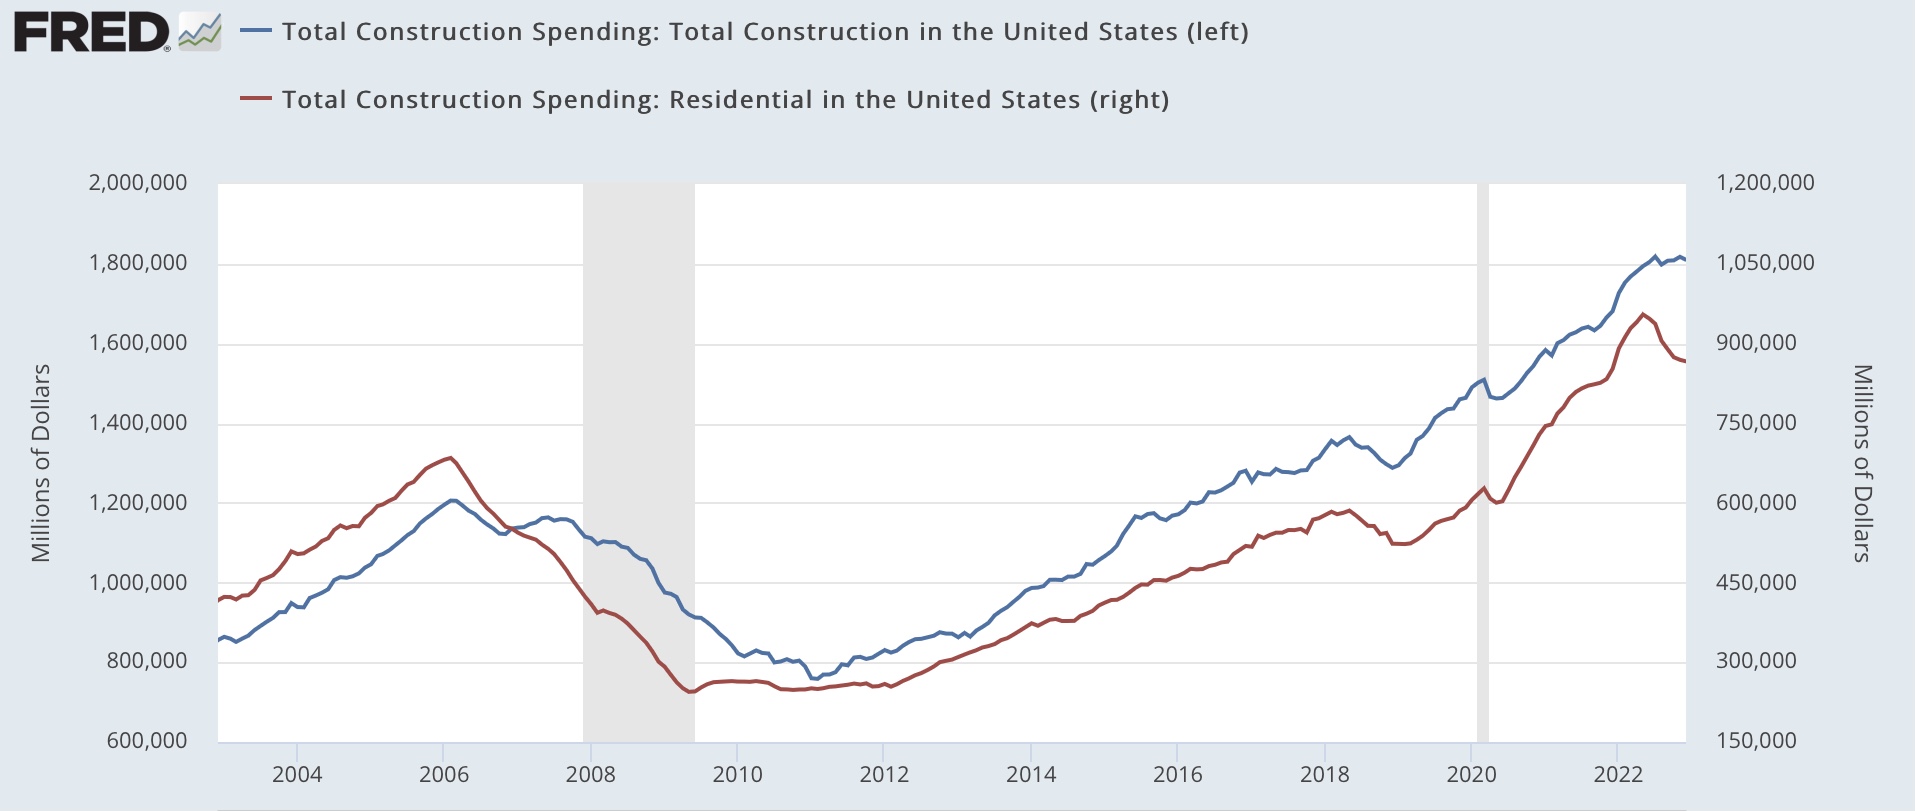
Construction spending for December was also reported, with a decline of -0.4% overall (blue), and a decline of -0.3% in the more leading residential construction sector (red):


The one caveat to this negative news is that the PPI for construction materials declined -1.1% in December, meaning that “real” construction spending increased. Below I show the YoY% change in residential construction spending (blue) vs. the PPI for construction materials (gold):


Note that, generally speaking, the cost of materials follows the change in construction with a lag. We’ve had the housing boom; now we are in the beginnings of a housing bust.

Again, I’ll be watching to see if there is a decline in construction employment of Friday.

The December JOLTS report was also posted this morning. I’ll deal with it separately tomorrow, but note that it, unlike the other reports, was pretty positive, with a positive reversal in job openings in particular. Contra that, ADP’s private payrolls number for January reported this morning was the lowest in over a year at only +106,000. Again, on my list for special focus on Friday is whether the deceleration in the three month average of employment gains since early last year continues.

Tuesday, January 31, 2023

House price indexes for November: up like a rocket, down like a feather


 - by New Deal democrat


As I’ve repeated many times in the past 10 years, in housing prices follow sales with a lag. Housing permits peaked at the beginning of 2022, and starts followed several months later. 


This morning the FHFA and Case Shiller house price indexes for November showed continued declines from their seasonally adjusted June 2022 peak, and also continued to decline sharply from their YoY growth peak, presaging a similar decline in CPI for shelter by the end of this year.

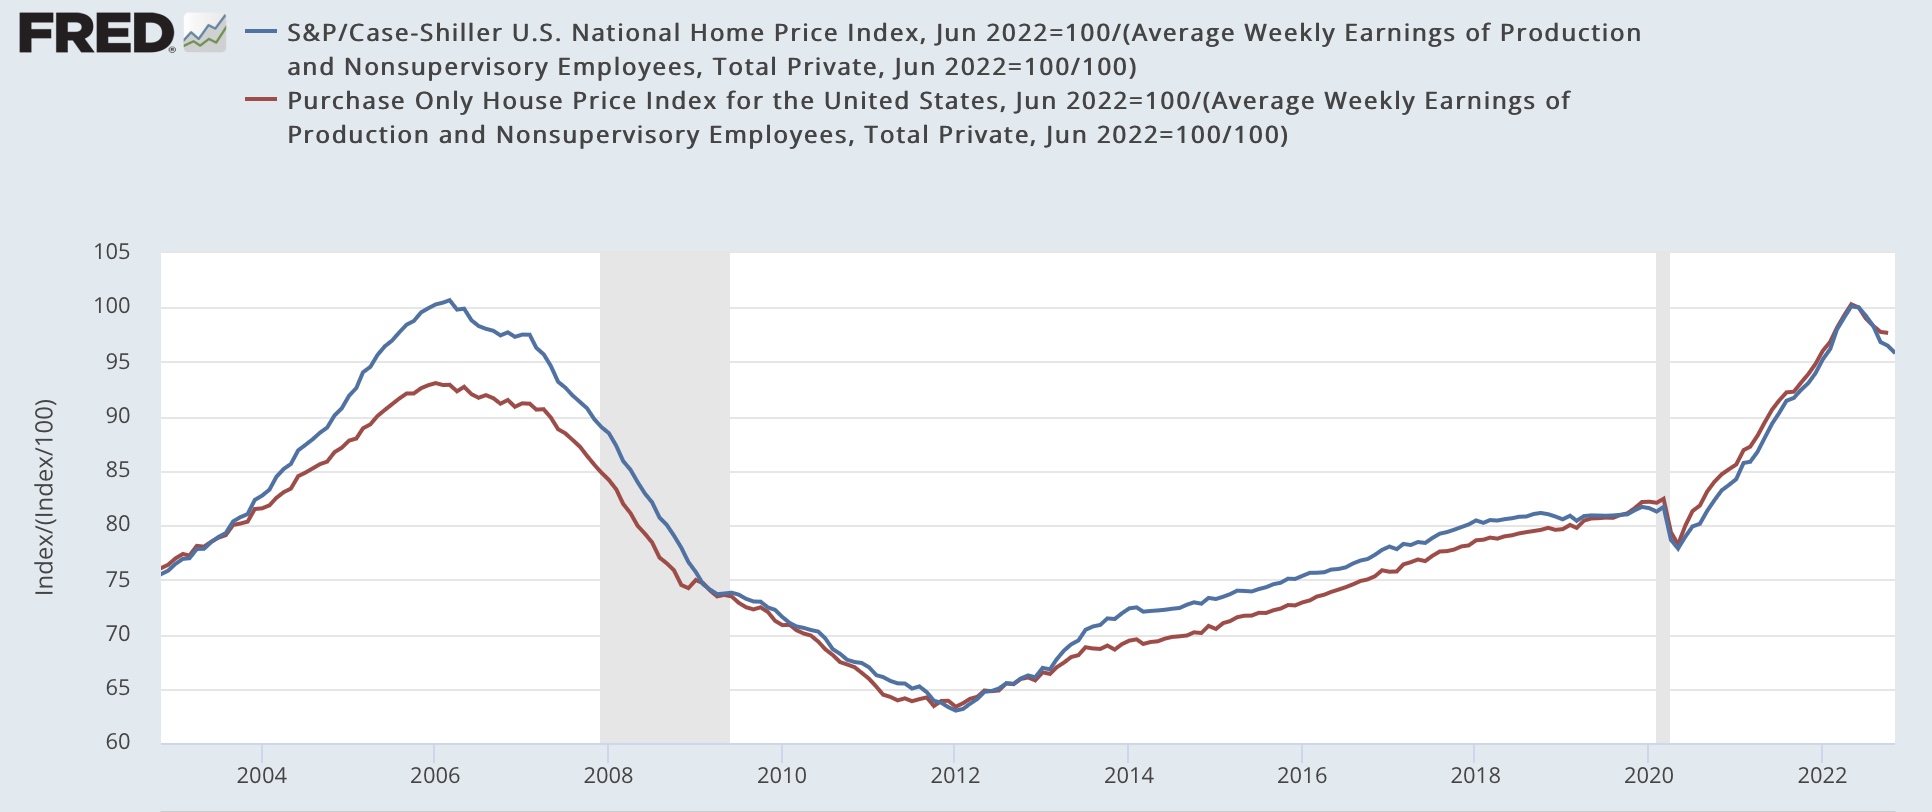
Here is what both look like normed to 100 as of their June peaks:


The FHFA index is down -1.0% since then, and the Case Shiller national index down -2.5%.

Between June 2020 and June 2022, the FHFA index increased by an average of about 1.5% a month! Since June, it has only declined by -0.3% a month. The Case Shiller national index also increased by an average +1.5% a month until June 2022, and has declined an average of -0.5% a month since.

In other words, in the aftermath of the pandemic house prices shot up like a rocket, but to date are only drifting down like a feather.

On the other hand, the YoY comparisons are getting much better. At their peaks during spring 2022, both measures of house prices were up about 20% YoY. As of November, the FHFA is down to +8.2% YoY, and the Case Shiller index +7.7% YoY:


At this rate, YoY prices will turn down by sometime this spring.

But as measured by households’ ability to make the down payment (leaving mortgage rates aside for this purpose), as shown in the below graph which norms house prices by the average weekly paycheck for nonsupervisory workers, house prices are still close to their all time highs:


Finally, as I have been emphasizing for over a year, house prices lead the CPI measure of Owners’ Equivalent Rent by 12 or more months. Here is the last 20 year history of the YoY% change in the Case Shiller Index (blue, /2.5 for scale) vs. Owners’ Equivalent Rent YoY (red):


The good news is that, whether we measure with reference to the FHFA or Case Shiller Indexes, the CPI measure for housing is on track to decline to about 3.0%-3.4% YoY by about the end of 2023 - very much within what ought to be the Fed’s comfort range. 

The bad news that we probably have a few months to go before the official measure of CPI for shelter peaks, likely at 8.0% or higher. So far the Fed seems to be paying a lot more attention to current OER rather than forward-looking house prices.

Monday, January 30, 2023

What to watch most for in this Friday’s jobs report


 - by New Deal democrat


After a two week drought, this week a plethora of economic stats get reported. Most importantly for my purposes that includes house prices, construction spending, the ISM manufacturing report, and of course on Friday nonfarm payrolls.


Speaking of which, 3 of the 5 short leading indicators that haven’t rolled over yet are included in the jobs report - construction and manufacturing employment, and short term unemployment. 

Since there aren’t any reports today, and since I’ve suddenly picked up a bunch of new followers at Seeking Alpha (probably because my articles document the economy sliding towards recession, which always seems to appeal to more folks than saying the economy is expanding or OK), I’ve posted a nice article there going into detail about what to look for in this Friday’s jobs report.

Clicking over and reading will not just give you the details, but hopefully give me enough coin to cover another lunch at my favorite watering hole.

Saturday, January 28, 2023

Weekly Indicators for January 23 - 27 at Seeking Alpha


 - by New Deal democrat

“Slowly I turn. Step by step . . .” That old Vaudeville bit comes to mind in watching the coincident indicators creep towards a recessionary downturn on a weekly basis.

Also, some of the long leading indicators are also creeping in the direction of  no longer being negative.

Which is a longer way to say, my Weekly Indicators post is up at Seeking Alpha. As usual, clicking over and reading will bring you up to the moment on the economy, and bring me lunch money.

Friday, January 27, 2023

Good news and bad news on personal income and spending


 - by New Deal democrat


December personal income and spending had some material for both optimists and pessimists.


Let’s look at the good news first, mainly having to do with inflation. Both the total and core personal consumption deflator continued their overall deceleration in December, with the former up +0.3% for the month, and the latter, said to be much beloved by the Fed, up just enough to be +0.1% rather than unchanged. There’s been a lot of discussion about the abatement of inflation since June, and this is in line with that idea, as shown by the quarterly changes in both of the above metrics:


The quarterly changes in both deflators is at their lowest levels since Q1 2021.

The YoY% change also declined for both:


Similarly, real personal income excluding transfer receipts, one of the four coincident indicators typically used by the NBER to determine if a recession has occurred, also increased nicely, by 0.2%, in December, to a new all-time high:


If you wanted to tout good news, there it is. The bottom line is: a decline in gas prices from $5 to $3 in 6 months can do a world of good to inflation data.

Now let’s start to segue to the bad news.

Here is an update to the graph I’ve been running for about the past year, showing real personal income (red) and spending (blue) normed to 100 in May 2021, right after that spring’s stimulus spending splurge:


As noted above, real personal income continued to increase in December, and is up 1.3% since June, when gas prices were $5/gallon. But they remain -1.4% below their level of May 2021. And the increase in real personal spending appears to have reversed, down for the second month in a row, by -0.3%. It is down -0.5% since its peak at 4% over May 2021 levels.

Further, the personal saving rate increased 0.5% for the month, and is up 1.0% from its lowest level of 2.4% in September (which except for July 2005 was its all-time lowest reading):


Why is this bad? Because as expansions go on, consumers tend to go more and more out on a limb, i.e., their saving rate goes lower. When bad things start to happen, they pull in their horns, i.e., their saving rate increases. Although this is a noisy metric, it is one of the hallmarks of the onset of a recession, and is a crucial part of my “consumer nowcast” model, which turned negative about 3 months ago.

Also, real personal income excluding transfer receipts, discussed above, is only up 0.3% YoY. It has been essentially flat YoY since June. Here’s what that looks like historically:


A flat to negative YoY change in this metric has, with only one exception, for the past 60+ years meant a recession is occurring.

One final note: the personal income deflator goes into the calculation of real manufacturing and trade sales, another one of the “big 4” coincident indicators of recession used by the NBER. It declined for the second month in a row, by-0.4%:


It joins industrial production to become the 2nd of the “big 4” to have apparently rolled over. As discussed above, real personal income less transfer receipts remains positive (but with gas prices increasing again in January, it will have a much more challenging comparison next month), as does jobs growth.

To recapitulate: there was good news today on the inflation front, perhaps helping the Fed pause in raising rates; but there was bad news on most of the indicators which immediately precede or are coincident with a recession.


Thursday, January 26, 2023

Q4 2022 GDP positive, but both long leading components continue negative


 - by New Deal democrat


Here’s my last note for this morning.

Real Q4 GDP came in at +0.7%, or +2.8% annualized. While this is lower than most quarters in the past several years, as shown below:


Although not shown (due to the huge pandemic swings), it would have been slightly above average for any quarter in the 10 years that predated the pandemic.

But as usual, my focus is on the two long leading components in the GDP report: proprietors’ income, a proxy for corporate profits, and private residential fixed investment (housing) as a share of GDP.

 And the bottom line is, both were negative.

Proprietors’ income (blue in the graph below), a proxy for corporate profits (red), which won’t be reported for another two months, were up +3.2% nominally. The “official” leading metric uses unit labor costs as a deflator, which we also don’t know yet, so I’ve substituted the implicit GDP deflator as a temporary fix: 


As deflated, they were down -0.4% for the quarter, and -4.0% since their Q2 2021 peak. Employers who are making less profit start to cut back labor’s hours and jobs, or at least on hiring. In other words, this portends future further weakening of the jobs market.

Secondly, real private residential investment as a share of GDP is a long leading indicator popularized over 15 years ago by Prof. Edward Leamer. It tends to turn down 6-7 quarters before a recession hits. It is even slightly more leading when calculated in real inflation-adjusted terms. Unsurprisingly, in Q4 of last year this took another bad hit:


This metric has been screaming “recession!” for several quarters now; just remember that supply constraints mean that housing units under construction made an all time high last month, as reported in last week’s monthly update for December.

This adds even more evidence for the proposition that there will be a recession this year.


Durable goods orders come in mixed; leaving only employment indicators as short term positives for the economy


 - by New Deal democrat


Manufacturers’ durable goods orders, and in particular “core” orders, which exclude defense and transportation (a/k/a Boeing), are (albeit noisy) a short leading indicator. I normally don’t pay too much attention to them because of that noise, and because they are less reliable than other indicators; but until recently, they were one of the few positive short leading indicators remaining - so I have been interested in when they might roll over. 


Here’s the long term look at each for the past 25 years:


To cut to the chase, while total durable goods orders rose 5.6% for the month, core capital goods orders declined -0.2%:


This isn’t quite “rolling over,” but on the other hand, core capital goods orders haven’t made a new high since August.

The bottom line is that they are basically neutral. At this point only labor market indicators remain positive for the near term economy.

Jobless claims continue recent strong streak


 - by New Deal democrat


Programming note: I’ll put up separate posts on durable goods orders, real manufacturing and trade sales, and the Q4 GDP reports later.


Initial jobless claims have been the best performing - and perhaps only positive - element of the short leading indicators in the past few months. And that continued in this morning’s report.

Initial claims declined -6,000 to 186,000, the lowest number since last April. The 4 week average declined -9,250 to 197,500, the lowest since last May. Continuing claims with a one week delay increased 20,000 to 1.675 million, still -43,000 below their recent high in December:


Only continuing claims were higher YoY. Initial claims, and more importantly, their 4 week average, were down YoY. Unless and until this number moves higher by at least 10% YoY, there is no recession warning:


In that regard, I’ve read some commentary indicating that a recession can’t start with initial claims so low. This is not really true, as there is no “magic number” of initial claims that correlates with recessions. Rather, past history indicates it is the *change* in initial claims which is the best indicator.

To show that recently, here are initial claims averaged monthly for the past year (blue) vs. job grains for the past year (light brown, right scale):


On a monthly basis, initial claims have varied between 180,000 and 245,000. But monthly job gains declined from over 700,000 to just over 200,000 during that same period. There would be no such huge decline in the number of jobs gained monthly if there were the claims big correlation between the number of initial claims and jobs. 


Wednesday, January 25, 2023

Three most quickly reported measures of coincident indicators - all of which are close to turning negative


 - by New Deal democrat


While we await tomorrow morning’s deluge of Almost Every Economic Series Imaginable, I have posted over at Seeking Alpha a detailed look at one measure of consumer spending and two of employment which will give us extremely timely warnings as to whether a recession has started. I explain their trajectory in the past year in detail, and how close they are to actually turning negative.

I definitely expect them to turn negative before any monthly data confirms if and when a recession has begun.

As usual, clicking over and reading will help you understand the economic situation, and bring me a little change in my pocket.

Tuesday, January 24, 2023

Index of leading indicators says recession almost certain; so what of the coincident indicators?


- by New Deal democrat


This week is one of those where almost all of the important data is crammed into one day - in this case, Thursday, when Q4 GDP, initial claims, real manufacturng and trade sales, durable goods orders, and new home sales will be reported all at once.


In the meantime, you may have heard that yesterday the Index of Leading Indicators declined again, by -1.0%. This marks the 9th straight decline in the index, which is now -5% below its recent peak (via Advisor Perspectives):


(Don’t know why the December level is labeled 97.9%. I have verified that the Index has indeed declined -5% to 95% since its recent peak, as shown).

The index has *never* declined this much without a recession having occurred. In fact, its current decline is almost as much as, or even more than, 3 recessions in the past 60+ years (1960, 1970, 1982) and nearly 50% as deep as the maximum declines in 3 others (1980, 1990, 2001).

So, if the leading indicators are down sharply, what is the current status of the “big 4” monthly coincident indicators that the NBER has indicated it pays the most attention to? Here they are, each normed to 100 as of their respective most recent peaks:


Three of the four - industrial production, real sales, and real personal income - made troughs in June. Industrial production has since rolled over, but the other two have continued to rise since that time.

This tells us that the price of gas has played an important role in their levels, and especially in real sales and real income. Since gas prices continued to decline in November and December, that will give them another boost:


Even so, that is probably not going to be enough to save real sales for November, which will be updated on Thursday. We already know that real retail sales declined that month, and nominally, so did both manufacturing and wholesale sales as well, as shown in total (nominal) business sales:


Nominally total sales declined -0.8% in November. It is unlikely that the inflation adjustment will be enough to reverse that sign. If so, that will be the 2nd of the 4 metrics to have rolled over. We’ll see about real personal income less transfer receipts on Friday.

Monday, January 23, 2023

How “FHFA-CPI” using house prices rather than OER shows a sharp deceleration in inflation


 - by New Deal democrat


Paul Krugman made another foray into the “inflation is mostly gone” genre over the weekend with a thread on Mastodon that largely relied on the following graph:


concluding that

“[A]t this point the burden of proof lies on anyone claiming that we had more than a, well, transitory inflation spike that’s mostly behind us.”

I’m very disappointed with Krugman’s argument, mainly because his “supercore” measure of inflation boils down to “if we exclude all the items that CPI says are really going up in price, plus gas, then things aren’t really going up in price.”

Well, duh.

Since the inflection point of all this argumentation is June, I thought I’d try a fairer representation of the main sectors involved. So, below is a bar graph that breaks all of the measures down to the First and Second Halves of 2022, starting with overall inflation (blue), then subtracts food and energy (red), energy (gas) (gold), and shelter (purple). The final three bars focus on shelter (brown), house prices via the FHFA purchase only index (lavender), and finally energy (teal):


This makes it clear that both total and core inflation aren’t very different in H2 than in H1. In fact as officially measured shelter prices accelerated from +2.7% in H1 to +3.8% in H2. 

The big declines are in house prices, which aren’t in the official CPI and which declined from +8.6% in H1 to -0.4% (-0.27% through October, the last month reported, extrapolated to 6 months) in H2; and energy, which decelerated from +18.2% in H1 to +0.3% in H2 (this despite the huge drop in gas prices from $5 to $3 between June and December).

So I disagree with Prof. Krugman’s analysis using his cherry-picked “supercore.” Inflation, as officially measured, isn’t “mostly behind us.” 

Nevertheless, if the question is, “Should the Fed continue to raise rates?” then I arrive at the same conclusion, but for a different reason; namely, that officially measured CPI for shelter lags what is actually happening in the housing market (as represented by prices) by 12 or more months. I show that below via “FHFA-adjusted” total and core CPI, which substitutes the FHFA purchase only index for CPI shelter. The only difference is, since the FHFA has only been reported through October, the below graph is quarterly rather than semi-annual:


Now it is clear just how much inflation, as it more properly ought to be considered by the Fed, has sharply decelerated since June.


Sunday, January 22, 2023

Weekly Indicators for January 16 - 20 at Seeking Alpha


 - by New Deal democrat


I forgot to post this yesterday, so here you go today . . . 


My “Weekly Indicators” post is up at Seeking Alpha.

Every now and then you get a contratrend week, when a bunch of metrics move in the opposite direction as the overall recent trend. This past week was just such a week, primarily among financial indicators.

As usual, clicking over and reading will bring you up to date on what the contratrend move is, and will bring me a little change in my pocket.


Friday, January 20, 2023

Existing home sales and prices decline; plus, a closer look at multi-unit housing construction


 - by New Deal democrat


I will keep my comments on December existing home sales and prices brief. That’s because, even though they make up about 90% of the total market, they have much less economic impact than new home construction. They are best used to confirm trends; in this case, that housing sales have continued to decline, and prices (which follow sales with a lag) have also rolled over.


And confirm both trends they did. December sales declined another -1.5% to 4.02 million annualized, a -34% YoY decline. Via Mortgage News Daily, here’s what they looked like for the last 3 years through November:


The median price of an existing home, which isn’t seasonally adjusted, declined further to $366,900, only a 2.3% YoY increase from 2021’s $358,800. My rule of thumb for non-seasonally adjusted data is that the trend has turned when the YoY increase is less than 1/2 of its maximum increase in the past 12 months. That was January 2022’s +17.1%. Needless to say, only a 2.3% YoY increase in December confirms that prices have turned down. Here’s what YoY prices also look like for the past 3 years through November:


With that out of the way, I wanted to follow up a little on yesterday’s post about housing construction, since I read a piece that pointed out that the remaining strength in the market is multi-family construction.

Indeed, that is the case. Single family housing under construction peaked at 828,000 units annualized in April, and is down -7% since then, while multi-unit construction has continued to increase since that time from 827,000 units annualized to 926,000, a 12% increase:


This is not unusual. A long term look indicates that with the exception of the 1980s, multi-unit construction has always peaked later than single family construction:


This is generally because apartment and condominium living is typically a less expensive alternative to buying a single family home. When prices get steep enough, young buyers in particular find that apartments or condos are their only affordable option.

Still, with the exception of the pandemic, and at the tail end of the 2000s housing bubble, even multi-unit construction has turned down in advance of recessions. The latest occasions (outside of 2007, when there was a -3% decrease followed by a 6% increase up until the recession began) were in 1973 and 1981, where multi-unit construction peaked 4 months before the onset of the recessions, and declined -3% and -7% respectively. Most often, multi unit construction peaked no later than 4 months after single family construction, although in the case of the housing bubble, it took over 2 years!

Since the YoY% pace of multi-unit construction growth has only slowed from 27% in August to 24.8% in December, it appears we are at least a few months away from this sector rolling over.

Edited to Add: In the past, multi-unit housings under construction has generally peaked 1-5 months after the 3 month average of multi-unit starts has peaked. The below graph shows such starts both monthly (which are very noisy, blue) and quarterly (gold) to best show this:


The 3 month average of multi-unit starts appears to have just peaked in Sep-Nov, so it is likely that multi-unit construction turns down by April.


Thursday, January 19, 2023

The actual Big News in this morning’s housing report was - positive


 - by New Deal democrat


For the second month in a row, the biggest news in the housing report was not in the headlines. 


Most of what you are going to read is about how bad housing permits and starts were, and that they are recessionary.

And it’s true. In particular, the most leading and least noisy housing metric of all is single family permits, and they declined another 6%+ to 830,000 annualized, their lowest reading in over 5 years excepting the pandemic lockdown month of April 2020:


They are also down 39% from their peak in early 2022. This is recessionary, plain and simple.

The recessionary or near-recessionary figures also include total permits (gold in the graph below), down 1.5% to 1330 for the month and down 30% from their 2022 peak, also the lowest in 4 years except for two pandemic lockdown months; and total starts (blue), down 1.4% for the month, down 19% from their 2022 peak, and also the lowest since the pandemic lockdowns. I’ve also included housing permitted but not started (gray, right scale), which is down 4% from its peak in October. We’ll come back to the red line later:


But that’s not the most important story in this morning’s report.

As shown in the two graphs below, going back 50+ years, the typical pattern in the housing market is:
1. Permits (gold) peak
2. Within a month or two later, starts (blue) peak.
3. After that, units permitted but not started (gray) peak.
4. Finally, housing units under construction (red) peaks:


To make the relationship easier to see, below I’ve simply included permits (blue) and units under construction (red):


Going back 50+ years, units under construction have *always* peaked with a delay, and *always* declined, almost always by over 5% (the exceptions being 2001 and the pandemic) before a recession began.

And what happened with housing units under construction in December? They made an all-time high, that’s what (as best shown in the close-up graph of the last two years above).

Most importantly, it is housing units under construction, not permits and not starts, that are the “real” economic activity in housing.

I am surprised that actual housing construction has held up this long - and this past year has been the biggest lag ever between the downturns in permits and starts, and a downturn in construction. And I *do* expect it to ultimately follow suit, and turn down in a big way. But until this happens, new housing construction is making a *positive* contribution to the economy.

That’s the actual big news from the December report.