Saturday, May 7, 2022

Weekly Indicators for May 2 - 6 at Seeking Alpha


 - by New Deal democrat

My Weekly Indicators post is up at Seeking Alpha.

Over the past few months, indicators across all timeframes have deteriorated. With increasing interest rates, and another Fed rate hike, that trend continued, and spread to credit conditions in a significant way.

As usual, clicking over and reading will bring you up to the virtual moment, and will bring me some lunch money.

Friday, May 6, 2022

April jobs report: strong Establishment survey, very weak Household survey (UPDATED)


 - by New Deal democrat

I got a late start on this report today. I’ll add a much more detail shortly, but for now, be advised in summary that while the establishment report was strong, with mainly positive internals, the household report was very weak, with some very weak, albeit mainly still positive, internals.

To be continued . . . 
——-
UPDATE:

Just as one month ago, I was most interested in three main issues:

1. Is the pace of job growth beginning to decelerate?  (Not in the establishment survey, *definitely* in the household survey)
2. Is wage growth holding up? Is it accelerating? (It is still strong, but decelerated slightly)
3. Are the leading indicators in the report beginning to flag? (Not yet, at least not significantly)

We still have 1.2 million jobs, or 0.8% of the total to go to equal the number of employees in February 2020 just before the pandemic hit. At the current average rate for the past 6 months of 552,000 jobs added per month, that’s 2 months from now

Here’s my in depth synopsis of the report:

HEADLINES:
  • 428,000 jobs added. Private sector jobs increased 406,000. Government jobs increased by 22,000 jobs. 
  • The alternate, and more volatile measure in the household report indicated a gain of only 115,000 jobs, after a February gain of 122,000 and a March gain of 120,000 - or an average gain of only 119,000 jobs per month for the last 3 months. The above household number factors into the unemployment and underemployment rates below.
  • U3 unemployment rate was unchanged 3.6%, 0.1% above the January 2020 low of 3.5%.
  • U6 underemployment rate *rose* 0.1% to 6.0%, 0.1% above the January 2020 low of 6.9%.
  • Those not in the labor force at all, but who want a job now, rose 122,000 to 5.859 million, compared with 4.996 million in February 2020.
  • Those on temporary layoff rose 66,000 to 853,000.
  • Permanent job losers declined -13,000 to 1,386,000.
  • February was revised downward by -36,000. March was also revised downward by -3,000, for a net decline of -39,000 jobs compared with previous reports.
Leading employment indicators of a slowdown or recession

These are leading sectors for the economy overall, and will help us gauge whether the strong rebound from the pandemic will continue.  These were positive:
  • the average manufacturing workweek, one of the 10 components of the Index of Leading Indicators, declined -0.1 hour to 41.4 hours.
  • Manufacturing jobs increased 55,000. Since the beginning of the pandemic, manufacturing has still lost -56,000 jobs, or -0.4% of the total.
  • Construction jobs increased 2,000. All of the jobs lost during the pandemic, plus another 738,000, have been made up. 
  • Residential construction jobs, which are even more leading, increased 3,500. Since the beginning of the pandemic over 50,000 jobs have been gained in this sector.
  • Temporary jobs rose by 2400. Since the beginning of the pandemic, almost 250,000 jobs have been gained.
  • the number of people unemployed for 5 weeks or less declined by -67,000 to 2,227,000, which is 97,000 higher than just before the pandemic hit.
  • Professional and business employment increased by 41,000, which is about 750,000 above its pre-pandemic peak.

Wages of non-managerial workers
  • Average Hourly Earnings for Production and Nonsupervisory Personnel: rose $0.10 to $27.12, which is a 6.4% YoY gain, down from 6.7% in the past two months. 

Aggregate hours and wages:
  • the index of aggregate hours worked for non-managerial workers rose by 0.3%, which is a  loss of -0.4% since just before the pandemic.
  •  the index of aggregate payrolls for non-managerial workers rose by 0.7%, which is a gain of 12.4% (before inflation) since just before the pandemic.

Other significant data:
  • Leisure and hospitality jobs, which were the most hard-hit during the pandemic, rose 78,000, but are still -1,438,000, or -8.5% below their pre-pandemic peak.
  • Within the leisure and hospitality sector, food and drink establishments added 43,800 jobs, and is still -793,800, or -6.4% below their pre-pandemic peak.
  • Full time jobs *declined* -651,000 in the household report.
  • Part time jobs increased 189,000 in the household report.
  • The number of job holders who were part time for economic reasons declined by -137,000 to 4,033,000, which is still below their level before the pandemic began.
  • The Labor Force Participation Rate declined -0.2% to 62.2%.

SUMMARY

This report had a decidedly split personality. The Establishment report, which asks employers about their hiring, continued to hit on almost all cylinders, with both the total number of new jobs, and the growth of jobs in the leading sectors, continuing to increase at a solid clip. Although the YoY pace of wage gains decelerated a little, it still increased solidly as well. The only downsides were the decline in the manufacturing workweek, and more importantly, the slight downward revisions of the past two months.

The situation was completely different in the Household report, which asks individuals what their employment situation is. This month - and the previous two months as well - increased at a rate that didn’t even keep pace with the growth in the adult population. The unemployment rate held steady, but the underemployment rate rose, and the labor force participation rate declined. The number of persons working full time also declined significantly.

At turning points, the household report generally leads the establishment report. So the softness in the household report raises a caution flag. I have been expecting the sharp deceleration in consumer spending to show up in hiring, and this month’s household report may be the first sign of that happening.

Thursday, May 5, 2022

New jobless claims: a possible reversal with a slight rising trend


 - by New Deal democrat

Initial jobless claims rose 19,000 to 200,000, continuing above the recent 50+ year low of 166,000 set in March. The 4 week average also rose by 8,000 to 188,000, compared with the all-time low of 170,500 set four weeks ago. On the other hand, continuing claims declined -19,000 to 1,384,000, yet another new 50 year low (but still well above their 1968 all-time low of 988,000):


The “job openings” component of the March JOLTS report released on Tuesday, indicated that there was no abatement in the number of employers participating in the new game of employment “musical chairs.” But the graph above shows a slight trend of increased new layoffs, which might just be noise. Or maybe not.

Wednesday, May 4, 2022

The impact of supply constraints on the US economy in 3 easy graphs


 - by New Deal democrat

The two most important purchases ever made by most consumers are (1) their houses, followed by (2) their motor vehicles. Indeed, according to Prof. Edward Leamer‘s forecasting model, ever since the end of World War 2 almost all American recessions have been preceded by, first of all, a decline in new home purchases about 6-7 quarters before, followed by a decline in the purchase of new motor vehicles about 9-12 months before.


By all reasonable accounts, the US economy Boomed last year, with real GDP up 5.5%, industrial production up 3.4%, manufacturing up 3.9%, and employment up 4.7%.

So one would think that the production of houses and motor vehicles would approach prior expansion peaks. Well, let’s take a look.

The below graph shows houses where permits have been issued, but construction has not yet started (blue), and sales of cars and light trucks (pickups and SUV’s)(red):


On average over the past 50 years, in any given month the number of new houses where construction has not yet started has averaged about 180,000. The number of new car, pickup, and SUV sales have averaged about 16-17 million during expansion years.

Here’s a close-up since just before the pandemic:


As of one month ago, 300,000 new houses had been authorized but not yet started. Light motor vehicle sales were 13.4 million. That’s 40% more houses than usual, and 25% fewer light vehicles than on average. 

In short, supply constraints (e.g., lumber and semiconductors) have seriously impacted the production of the two most important consumer staples.

Unsurprisingly, the prices of both have skyrocketed, up about 20% since the end of 2020:


This is a very simple explanation of the most serious economic problem in the US right now.

Tuesday, May 3, 2022

March JOLTS report: the game of musical chairs in the jobs market intensifies to all-time highs


 - by New Deal democrat

In March, as this morning’s Census Bureau JOLTS report shows, the game of musical job chairs in the jobs market has actually intensified to all-time levels. Specifically, both job openings and quits made all-time highs, and total separations during their entire 20 year history were only higher in March and April 2020.

As a refresher, some months ago I introduced the idea that the jobs market was like a game similar to musical chairs, where employers added or took away chairs, and employees tried to best allocate themselves among the chairs. Because of the pandemic, there are several million fewer players trying to sit in those chairs, leaving many empty. As a result, wages have continued to increase sharply, as employers attempt to attract potential employees to sit in the continuing big number of empty chairs.

I’ve followed up by positing that the game of musical chairs will only slow down once some employers throw in the towel, and the number of job openings signficantly declines. As noted above, in March the opposite happened.

To the numbers . . .

Layoffs and discharges (violet, right scale in the graph below) rose 51,000 to 1.405 million, a 6 month high, versus their record low of 1.262 in December. Total separations (blue) rose 239,000 to 6.321 million (graph starts in June 2020 for reasons of scale):

[Note: FRED inexplicably hasn’t updated with today’s data yet. I’ll update this post once they do. In the meantime, below I’ve copied similar graphs from other sources/]


On a historical level, layoffs still continue to be very low.

Meanwhile, job openings (blue in the graph below) rose 205,000 to 11.549 million, a new all-time high. Previously openings had appeared to be leveling off after gradually increasing to repeated record highs. Voluntary quits (the “great resignation,” gold, right scale) rose 52,000 to 4.536 million, also following a period of apparent leveling off. Actual hires (red) declined 95,000 from February’s revised all-time high of 6.832 million to 6.737 million:


In summary, and to reiterate, the message of these numbers is that the competition by employers to attract employees has only intensified. Because of the continuing yawning gap, wages have continued and should continue to soar. As shown in the below graph of job openings divided by actual hires (blue, right scale), where 1.0 represents the level at which the number of openings and hires are equal, in the last 18 months this ratio has repeatedly made new all-time highs.


Thus I expect this Friday’s jobs report to show that wages continue to rise at a very strong pace, even though the slowing in consumer spending growth points toward weaker monthly gains in the number of jobs.

Monday, May 2, 2022

Manufacturing and construction start out the month with positive prints


 - by New Deal democrat

As per usual, the new month starts with updates on manufacturing and construction.

The ISM manufacturing index, and especially its new orders subindex, is an important short leading indicator for the production sector. This remained positive, but there has been a definite slowing in the past two months.

In April the index declined from 57.1 to 55.4, and the new orders subindex also declined from 53.8 to 53.5, the lowest reading since 2020. As noted above, these remain positive, since the breakeven point between expansion and contraction is 50:


This forecasts a continued expansion on the production side of the economy through summer - but nowhere near the red-hot and even white-hot pace of last year.

Meanwhile, construction spending for March rose 0.1% in nominal terms for overall spending including all types of construction, while the leading residential sector also rose 1.0%, both thus making new highs:

On a YoY basis, nominal residential construction spending is up 18.2%!

Adjusting for price changes in construction materials, which rose 0.4% for the month, and have *declined* ever so slightly in the last two months combined, “real” construction spending declined -0.3% m/m, and residential spending rose 0.6% m/m. In absolute terms, “real” construction spending has declined sharply - by -17.4% - since its peak in November 2020,  while “real” residential construction spending has declined -10.4% since its post-recession peak in January of last year, and risen by about 5% in the past several months:


While total construction spending has declined by more than the -10.4% it did before the Great Recession, the decline in residential construction spending, while increasingly substantial, remains nowhere near the -40.1% decline it suffered before the end of 2007. In general this series has been helped considerably by the fact that the cost of construction materials has stopped rising, at least for now.

Together, these two reports point to continued growth, albeit at a slower pace, in manufacturing and construction* in the next few months.

*recalling that it takes awhile for the downturn in mortgage applications and sales to filter through into actual construction.

Saturday, April 30, 2022

Weekly Indicators for April 25 - 29 at Seeking Alpha


 - by New Deal democrat

My Weekly Indicators post is up at Seeking Alpha.

Conditions have been deteriorating for awhile. This week, for the first time, real M2 and at least one credit condition reading contributed to that deterioration in the long leading forecast, enough to make a significant difference.

To get brought up to speed on the potential implications, click on over and read the post. As usual, doing so will also reward me just a little bit for the efforts I put in to obtaining and aggregating the information. 

Friday, April 29, 2022

Lackluster spending, a decline in real income and savings in March; when the house price spiral turns, consumers are in real trouble


 - by New Deal democrat

In March nominal personal income rose 0.5%, and spending rose 1.1%. But since the personal consumption deflator, i.e., the relevant measure of inflation, rose 0.9%, real income declined -0.4%, and real personal spending rose only +0.2%.

While both real income and spending are well above their pre-pandemic levels, I have stopped comparing them with that, but instead with their level after last winter’s round of stimulus. Accordingly, the below graph is normed to 100 as of May 2021: 


Since then spending is up 2.4%, while income has declined -1.3%.

Comparing real personal consumption expenditures with real retail sales for March (essentially, both sides of the consumption coin) shows a small increase in the former and a decrease in the latter for the month. Both numbers can be considered lackluster:


Meanwhile, the personal saving rate declined -0.7% from a revised 6.8% in February to 6.1% in March. The below graph of the last 30 years subtracts 6.1% from all months, so that the current reading is shown as 0 (before then all values were higher than 6.1%): 


Usually the savings rate has tended to decrease as expansions grow longer, leaving consumers more vulnerable to shocks (e.g., gas prices). The current value is the lowest since 2013 (when a different stimulus program ended). In other words, so far consumes are making up shortfalls by digging into savings or tapping a source of credit.

One of my recession models - the “consumer nowcast” - is based on such a shock that is unable to be made up from increased real income, or an increased source of wealth to be cashed in. Income has clearly faltered, and stocks have not made a new high in over three months. That leaves housing equity - and as you may recall from my last installment on housing sales and prices, sales have taken a distinct dive, meaning that I fully expect house prices to follow suit. Whenever that happens, unless something else reverses, consumers - and the economy - are in trouble.


Thursday, April 28, 2022

Q1 GDP negative; but more importantly, two of three long leading indicators have deteriorated


 - by New Deal democrat

First things first: yes, it was a negative GDP print. No, it doesn’t necessarily mean recession. I’ve been expecting weakness to show up by now ever since last summer; so here it is.

But the big culprits were non-core items. Personal consumption expenditures, even adjusted for inflation, were positive. The three big negatives were a big decline in exports vs. imports, followed in about equal measure by a decline in inventories and a downturn in defense production by the government. The inventory adjustment is temporary. So, most likely, was the downturn in defense production. We’ll see about exports and imports (supply chain issues!).

But there are two components of GDP which are helpful in finding out what lies ahead: real residential fixed investment (housing) and proprietors income (a proxy for business profits). Both of these have long and good track records as helping forecast the economy one year in advance. Here, the news was mixed, but a little more positive than negative.

Proprietors income (blue in the graph below) rose 1.2% nominally. Since unit labor costs have averaged an increase of 0.9% per quarter over the last year, they probably rose to a new high on an adjusted basis as well. This generally rises and falls with corporate profits (red), although it is not quite so leading. But since the latter won’t be reported for at least another month, it is a good placeholder:


So, this was a positive.

The news was more mixed in housing. Real private residential fixed investment rose slightly:


Further, both nominal and real residential fixed investment as a share of GDP (the actual measurement that is part of the long leading indicators) also rose for the quarter:


So far, so good. 

The problem is that recessions have typically happened on average 7 quarters after the last peak in this measure. And even with the improvement in Q1, this measure is still below its peak of one year ago. So real residential investment is still a negative for forecasting purposes.

In addition to the above two long leading components of GDP, real money supply for March was reported on Tuesday, and the news wasn’t good there, either.

Recessions have typically occurred one year or more after real M1 turns negative, or real M2 is up by less than 2.5% from one year previous. Here’s what they look like through March:


Real M1 is up 2.4% YoY, and has deteriorated rapidly, although it is still a positive. Real M2 is also up less than 2.5%, which means it is consistent with an oncoming recession.

All in all, the picture continues to deteriorate, even though the profits component held up in Q1.


Jobless claims: yet another 50+ year low in continuing claims


 - by New Deal democrat

[Programming note: I’ll comment on the Q1 GDP report later this morning].

Initial jobless claims declined -5,000 to 180,000, but above the recent 50+ year low of 166,000 set in March. The 4 week average rose 2,250 to 179,250, compared with the all-time low of 170,500 set three weeks ago. Continuing claims declined -1,000 to 1,407,000, yet another new 50 year low (but still well above their 1968 all-time low of 988,000):


This is yet another installment in the saga of “nobody is getting laid off.” The “job openings” component of the March JOLTS report, which will be released next Tuesday, is the next important metric, because that will tell us if there is any abatement in the number of employers participating in the new game of employment “musical chairs.”

Wednesday, April 27, 2022

Coronavirus dashboard for April 27: Estimating the BA.2.12.1 wave


 - by New Deal democrat


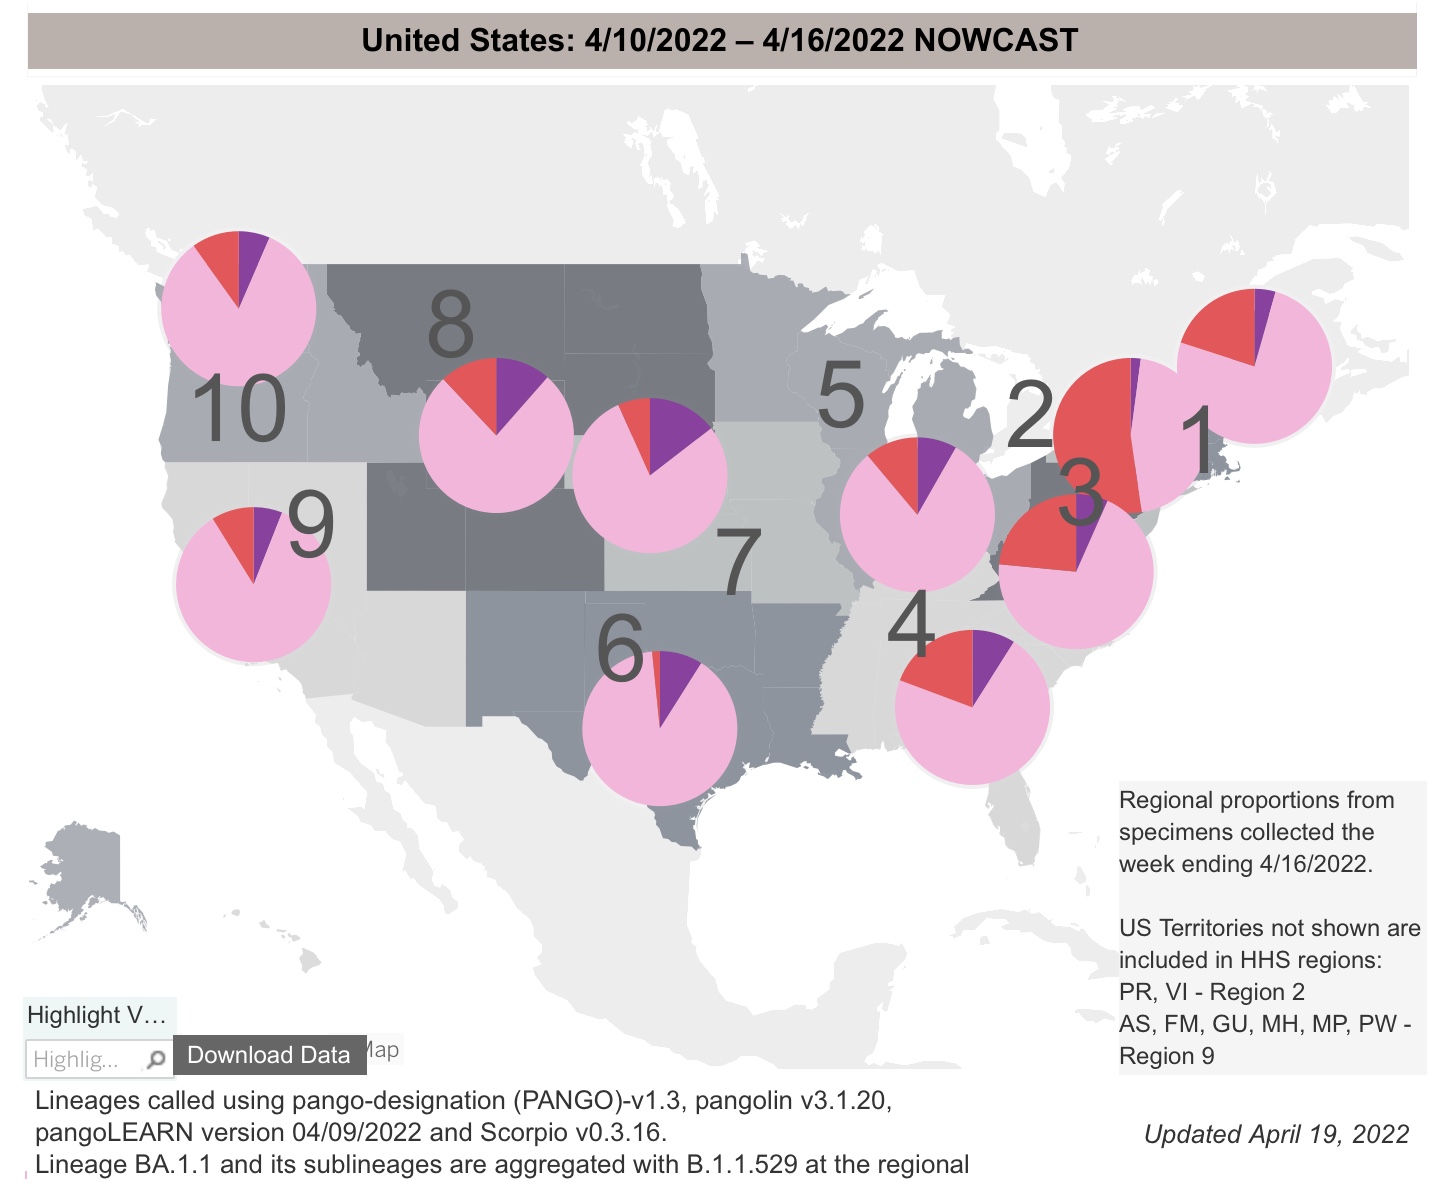
The CDC updated its variant proportions data yesterday. BA.2.12.1 cases grew from 19% to 29% of all US cases: 


and from 45% to 60% in NY and NJ. At the other end of the spectrum, BA.2.12.1 was only 9% of cases in the Pacific Northwest and 8% in the South Central region. BA.1 is down to only 2% of cases:


Focusing on NY and NJ, NJ has had a little spurt in the last couple of days, probably just due to an artifact of daily reporting one week ago, and is now up 15% for the week. Deleting that artifact, NJ is only up 4% for the week. NY appears to be peaking right now, 6.5 weeks after its recent lows, with cases essentially flat for the last 6 days, and up only 7% for the week. Cases tripled during that period:


For the US as a whole, as of yesterday cases rose to 50,300, and are up over 20% in the last week:


Hospital admissions rose 400 to 13,167, an increase of  almost 20% in the last week, but still a very low historical number:


Deaths declined to a new low of 338. Deaths were only lower in late June and July of last year:


Applying the template from NY to the US as a whole, I suspect we will see a US peak from BA.2.12.1 by about Memorial Day at 75,000-90,000 cases and 25,000-30,000 hospitalizations. Because deaths have not bottomed yet, where they will peak in this wave is much more uncertain, but as of now they seem likely to peak a little under 1000 by mid year.

The CDC also published an Important study of seroprevalence through February. I’ve cleaned up the text somewhat, and omitted the 2%-3% confidence interval noted for each subgroup.

 “During December 2021–February 2022, overall U.S. seroprevalence increased
  • From 33.5% to 57.7%. 
  • from 44.2% to 75.2% among children aged 0–11 years
  • from 45.6% to 74.2% among persons aged 12–17 years.
  • from 36.5% to 63.7% among adults aged 18–49 years
  • from 28.8%  to 49.8% among those aged 50–64 years
  • from 19.1% to 33.2% among those aged ≥65 years.

“[In summary, a]s of February 2022, approximately 75% of children and adolescents had serologic evidence of previous infection with SARS-CoV-2, with approximately one third becoming newly seropositive since December 2021. The greatest increases in seroprevalence during September 2021–February 2022, occurred in the age groups with the lowest vaccination coverage ....”

According to the CDC, 66%, or 196M of 258M adults have had at least 2 shots, and 50M, or 90% of seniors have. But only 43% of eligible children (ages 5-17) have had 2 shots.

The CDC noted that these findings are subject to some limitations, most importantly that “all samples were obtained for clinical testing might overrepresent persons with greater health care access or who more frequently seek care,” and “these findings might underestimate the cumulative number of SARS-CoV-2 infections because [testing for] seroprevalence cannot account for reinfections.”

I see no way to read this study without concluding that somewhere between 90%-95% of all Americans have either been vaccinated and/or infected (since 60% of the 34% unvaccinated amounts to only 13.6% of the population - and the unvaccinated have had confirmed cases at a *much* higher rate than the vaccinated). This is going to put enormous evolutionary pressure on the virus in the direction of immune avoidance. I think this also strongly suggests that the fatality rate will continue to decline.

So we will await the next variant, which if it arrives 3-4 months after BA.2.12.1, will be in June or July.


Tuesday, April 26, 2022

Prices soar, sales drop; oh by the way, sales lead prices


 - by New Deal democrat

New home sales declined -8.6% in March, which isn’t a sharp as it seems, since declines of this magnitude happen 2-3x/year. The series is also heavily revised, so no new month’s number should be given too much weight. On the other hand, new home sales are frequently the first series to decline after a peak, so the fact that they have not made a new high since January of last year, and are now almost 25% below that mark is certainly a sign that higher interest rates and prices have taken their toll:


Very much on the other hand, the month over month % change in both the Case Shiller and FHFA Indexes rose at record paces of ~2% last month alone:


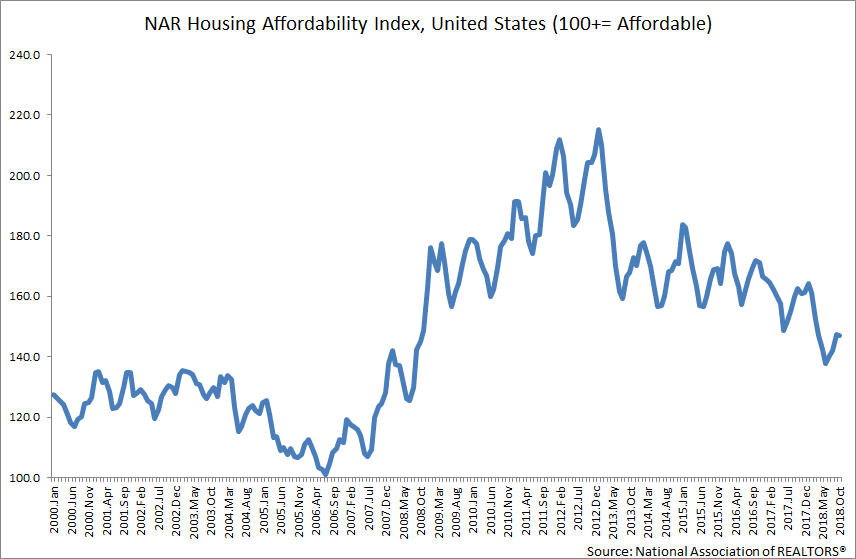
All of this has caused the National Affordability Index kept by Realtor.com to decline to 135:


This is the lowest level of affordability since 2008 (note below graph stops in 2018)


And as I always say, sales lead prices, so here is the YoY% change in sales (averaged quarterly, blue) vs. both FHFA and Case Shiller prices:


So it shouldn’t take a genius to figure out where I think home prices are headed. 

Lessons for the present from the Postwar Boom


 - by New Deal democrat

One of the things I harp on from time to time is that from 1932 to 1956 there was never a yield curve inversion, and yet recessions certainly did happen! Too many modern models get hung up on Fed intervention.

But what happens when the Fed doesn’t intervene, as was the case for that 25 year period? Or is perhaps the case now, with the Fed funds rate at record levels below the inflation rate?

The case of the immediate postwar Boom of 1946-48 and the recession of 1949 bears a lot of similarities to our current situation - but some significant differences too.

I wrote a lengthy post about it, and it is up at Seeking Alpha.

A factor I didn’t even get in to in that discussion was how the GI Bill, and the swift integration of returning servicemen into the labor force mirrors the swift increase in re-employment of those laid off during the initial period of lockdowns and closures.

For example, the modern unemployment rate statistics just started to get published in 1948, and like now, it was close to 3%:


As usual, by clicking over and reading, you should learn some important historical information, and it also  puts a couple of pennies in my pocket as well.

Saturday, April 23, 2022

Weekly Indicators for April 18 - 22 at Seeking Alpha


 - by New Deal democrat

My Weekly Indicators post is up at Seeking Alpha.

While I was writing about mortgage rates during the week, the yield curve did some re-tightening, enough to make a difference in the long term forecast.

As usual, clicking over and reading should help bring you up to the virtual minute as to the nowcast and forecast for the economy, and help me pay for some nice tapas the next time I dine out at a Spanish restaurant.

Friday, April 22, 2022

Mortgage rates continue to rise; once the backlog in construction is cleared, this will likely kill housing


 - by New Deal democrat

No important economic news today, but an important negative trend in interest rates is continuing. Mortgage rates are now at 12 year highs.


The weekly data from Freddy Mac’s weekly survey shows rates increased to 5.11% as of April 21:


This is 2.46% above the low of 2.65% that was set at the end of 2020, and the highest rates since April 2010. It is also only 1.69% below the 6.80% rate that killed the housing bubble in 2006.

And according to Mortgage News Daily, as of today rates have increased further to 5.38%.

Here’s an update of a graph I ran earlier this week, showing the YoY change in mortgage rates, inverted and *10 for scale, vs. the YoY% change in single family permits (red) and starts (gold):


Unless this situation reversed quickly, once the backlog in housing starts abates, this is going to absolutely kill the housing market.

Two very important long leading indicators are going to be updated next week: real money supply for March, and corporate profits (via proprietors’ income) for Q1. 

Stay tuned.

Thursday, April 21, 2022

Jobless claims: more 50+ year lows


 - by New Deal democrat

Initial jobless claims declined -2,000 to 184,000, another 50+ year low. The 4 week average rose 4,500 to 177,250, compared with the all-time low of 170,500 set two weeks ago. Continuing claims declined -58,000 this week to 1,417,000, a new 50 year low (but still well above their 1968 all-time low of 988,000):


Nobody  - still - is getting laid off. We’re still about 1.6 million shy of “full employment,” by my calculation. Further, the game of “musical chairs” whereby workers can always find higher wages somewhere is still very much happening. 

The next important marker is going to be “job openings” in the March JOLTS report which will be released next week. That’s because this situation is going to go on until enough employers decide that they simply can’t afford the higher wages demanded, or because increased prices have cooled off demand enough that they can get by without hiring more workers. 

Wednesday, April 20, 2022

Coronavirus dashboard for April 20: there’s a new subvariant in town


 - by New Deal democrat


Let me start with the current overview. As of today, Nationally cases are now rising sharply, up to 41,500, an increase of 25% in the past week:


Hospitalization are generally flat at slightly over 10,000, but new admissions have risen steadily, by 8% over the last 11 days:


Deaths have continued to decline, to 452, a level lower than all times during the pandemic except for 7 weeks last June and July:


But, conditions have changed.

Up until this week, my paradigm has been that cases in the US would follow the pattern in Europe, where once the BA.2 subvariant of Omicron reached roughly 90% of all cases, typically 2.5-3.5 weeks after the onset of the BA.2 wave, they peaked and then declined more or less rapidly.

Except . . . the Northeastern part of the US did not follow the pattern. Cases bottomed 5 weeks ago, starting in New York State, and have continued to rise ever since, and are now 2.6x the number they were at their trough:


The reason why the Northeast has been different from Europe, with cases continuing to rise for over a month, was first reported by the New York State Department of Health five days ago, in a press release that stated in relevant part:

“The New York State Department of Health today announced the emergence of two Omicron subvariants in New York State, BA.2.12 and BA.2.12.1.... The subvariants have been estimated to have a 23% – 27% growth advantage above the original BA.2 variant. Over the past few weeks, the Department has been investigating higher than average infection rates in Central New York.... State health officials have determined that these highly contagious new variants are likely contributing to the rising cases. For the month of March, BA.2.12 and BA.2.12.1 rose to collectively comprise more than 70% prevalence in Central New York and more than 20% prevalence in the neighboring Finger Lakes region. Data for April indicate that levels in Central New York are now above 90%.”

In other words, here was a new subvariant with a 25% advantage even over BA.2, and displaced it almost entirely - by more than 90%! -  in the region where first reported within  just a few weeks.

The US had just become to BA.2.12.1 what South Africa was to the original Omicron, and Central NY was like South Africa’s Gauteng region, where BA.1 was first identified.

Yesterday the CDC updated their variant tracker, and for the first time included BA.2.12.1 as a separate subvariant. Here is their chart of variant proportions nationwide:


And here is the graph of the regional breakdowns:


Per the report, as of last week BA.2 and it’s subvariants constituted 93.4% of all US cases. BA.2.12.1 already constitutes 19% of all US cases (up from 3.3% just 3 weeks ago, and on a trajectory equal to that of the original BA.2). At its current rate of growth, BA.2.12.1 will be over 90% of cases in the US in just 5 weeks.

Regionally the BA.2 variants are 95% in the Northeast and over 90% along the West Coast. Further, BA.2.12.1 is already over half of all cases in NY and NJ:


Fortunately, Trevor Bedford, whose genetic work has been invaluable whenever new variants have appeared, weighed in yesterday after a three month silence. Here’s the most relevant portions of his thread:

 “Variant “fitness” will depend on intrinsic transmissibility and escape from existing population immunity…..  BA.2’s advantage over BA.1 appears to be due to intrinsic transmissibility…. [T]he one to watch just based on mutations is B.2.12.1 which has spike mutations S704L and L452Q on top of BA.2 background. Previously, L452R appeared to have an important role in promoting the spread of Delta and also showed up in Epsilon and Lambda…. The hypothesis is then that 452R/Q is conferring some additional intrinsic transmission advantage…. This sort of accumulation of mutations that drive further host adaptation and antigenic drift is my general expectation for evolution in the coming months. It’s possible we may have additional ‘Omicron-like’ events, but my baseline is this steady ‘flu-like’ scenario.”

In short, the template of Europe’s experience with BA.2 no longer holds for the US, because of the emergence of BA.2.12.1. The US itself is the new template.


Fortunately, we have the Northeast generally, NY and NJ more specifically, and even more specifically than that the counties of the Finger Lakes and Central regions of NY State as canaries in the coal mine.

In that regard, there is some good, or at least “less bad” news. While cases in both NY and NJ are still growing, the 7 day rate of growth in NY has decelerated from 45% one week ago to under 20%, and in NJ from 35% to 12%. It is even possible cases peaked in NJ several days ago:


Further, cases have peaked already in 8 of 14 counties in the Central and Finger Lakes regions of NY region. Here’s the graph of cases for the Central NY region, where cases bottomed on March 9, and rose to their peak on April 15, a little over 5 weeks later:


So here’s the paradigm going forward: using the “ground zero” regions of NYS as our new template, most likely cases will rise in each State until BA.2.12.1 reaches roughly 90% of all cases. We’ll get there in a couple of weeks in the Northeast, but only in about 2 months in the interior Deep South and Great Plains, where BA.2.12.1 is only about 3% of cases now. Nationwide cases began to rise 4 weeks after they did in Central New York, only two weeks ago. Thus the nationwide peak may come in about 3 to 5 weeks, by which time this new subvariant should be 90% of all cases. But in Central New York, cases tripled during their wave. A tripling of cases nationwide would be roughly 90,000.

Further, since organized public health strategies have all but disappeared in the US, the course of the pandemic will depend on the regularity of the emergence of more efficient strains. In the past 10 months, such new strains - Delta, Omicron BA.1, BA.2, and now BA.2.12.1 - have arisen about every three months. The only good news has been that the  death rate has continued to decline, as gradually the population as a whole develops a level of resistance due to vaccination and/or prior infection.