Saturday, November 12, 2016
Weekly Indicators for November 7 - 11 at XE.com
- by New Deal democrat
My Weekly Indicator post is up at XE.com.
The big story this week was the upward spike in stock prices aind interest rates that presumably was a result of the US presidential election. These have different ramifications for the near and further future.


Friday, November 11, 2016
September JOLTS report: this cycle diverges from the last
- by New Deal democrat
The JOLTS Survey, like the Labor Market Conditions Index and the Senior Loan Officer Survey that I discussed yesterday, has great promise, but like those surveys, does not have a long enough real-time history to use with full confidence.
That shortcoming is on display in the September report, released earlier this week.
The below graph shows hires (blue), job openings (red), and quits (green, right scale) from the inception of the series nearly 20 years ago:

In the one and only complete cycle since the series began, hires and quits peaked first, while openings continued to increase until shortly before the onset of the 2008 recession. During this cycle, hires have gone sideways for over a year, while openings continued to rise until recently. Meanwhile quits just spiked to a new high.
Another way to look at this is YoY. Here's the YoY% change in from 2004-07:

Here is the YoY% change in the last several years:

In the last cycle, YoY job openings held up until nearly the end. This time around, it appears at least for now that openings may be turning before quits.
In other words, unless job openings make new highs in the months ahead, this cycle will not match the last one. We just don't have enough history with the JOLTS series to know which resolution is more likely.
One related point is that, generally, hiring slows down before firing increases shortly before the expansion ends. Here it is, comparing the quarterly average of the m/m% change in employment growth vs. the quarterly average of new jobless claims (right scale, inverted):

Note that employment growth (which is the net of hiring over firing) decelerates markedly before layoffs begin to increase (shown as a downturn in the graph).
JOLTS decomposes this into hiring (blue) vs. firing (red, right scale)(averaged quarterly):

We can see in the 2002-07 cycle that hiring decelerated before firing turned up. It appears that the same thing is happening now.
So the bulk of the evidence from JOLTS is that we continue to have late cycle deceleration, but with no imminent downturn. But take this with an extra grain of salt.
Thursday, November 10, 2016
Lending and Labor market conditions flash yellow (still)
- - by New Deal democrat
... and, rather than kill myself, it is back to econmic blogging ....
Two data series that are good candidates for long leading indicators, but don't have a long enough real-time records to rely on them too much, were updated earlier this week, and they continue to flash caution.
This post is up at XE.com.
Trump's First 100 Days: No Growth Here
Let's take a look at Trump's proposed economic plan to see if increased growth is in the cards.
In the first 100 days, he's promised two things: trade renegotiation and tax cuts.
“We don’t win on trade” was a frequent refrain heard at Trump rallies, and in response, the real estate mogul has said he will renegotiate NAFTA and withdraw from the Trans-Pacific Partnership. He said he will direct his secretary of the treasury to pursue action against Chinese currency manipulation.
Below are 2 charts: the first shows total Canadian and Mexican imports while the second shows Chinese imports:


The top chart is seasonally adjusted while the bottom chart isn't. That's actually an unimportant point. Instead simply note that trade with both countries has risen at a very strong pace for several decades.
Trump wants to renegotiate NAFTA, which creates a huge problem: companies have incorporated NAFTA into their operations for the last 20 years. For example, car companies have already moved plants across the border, as have other manufacturers. As for China, it too has been incorporated into the global value chain; companies have already transferred their facilities and operations to the mainland for a variety of reason. Renegotiating treaties with both won't undo that change; it's already built into the global system.
What it will do is potentially lead to a traded war, where countries begin to increase tariffs on imports as well as adding quotas to imports. This is a very bad idea; in fact, just such a situation (the passage of Smmot Hawley in 1930) greatly exacerbated the Great Depression.
Next, we have taxes:
On taxes, Trump pledged “the biggest tax cut since Ronald Reagan.” The Economic Recovery Tax Act of 1981 and Tax Reform Act of 1986, passed during Reagan’s presidency, simplified the tax code and lowered marginal tax rates by more than 20 percent for most citizens. Trump indicated that he will seek to reduce tax brackets from seven to three and called for business tax rates to be reduced to 15 percent.
Once again, supply side economics enters our political discussion. And it won't work as advertised. Republicans will point to the Reagan tax cut as proof that it does. But what they'll fail to mention is that in the 1980s, the labor force participation rate started to increase, which it continued to do until the late 1990s. This development was primarily responsible for our economic growth in the 80s and 90s. And as our population has aged our growth has slowed. This exact same situation is also occurring in Japan and the EU (they also have agin populations and slower labor force growth; it's a big reason why Germany was so emphatic about letting refugees in). So, unless we start increasing our labor force (by increasing immigration), we're pretty much stuck in Secular Stagnation mode.
Also consider: Kansas implemented supply side tax cuts a few years ago. The results have been disastrous (see this post from Menzie Chen for further information)
And finally, a massive tax cut will increase wealth inequality, which will exacerbate the economic environment that led to Trumpism in the first place.
So, to recap, Trump's policies so far show no increased growth potential. But he could start a debilitating trade war and increase wealth inequality.
Wednesday, November 9, 2016
The 2016 election economy: (nearly) final result
- by New Deal democrat
About an hour ago as I type this, Hillary Clinton pulled ahead of Donald Trump in the popular vote, 59.2 M vs. 59.0 M.
I have been saying for months that the economy forecast a narrow popular vote win for the incumbent party, on the order of 51%/49% (although with the recent good GDP and employment reports, I did up that to 52%/48%). IF the current numbers hold up, that will have been pretty close. As of this moment, the percentages are:
Clinton 47.7%
Trump 47.5%
others 4.8%
Certainly closer than my personal prediction of 49.5%, 46.0%, and 4.5% respectively, but also certainly consistent with the plodding economic expansion, and well within the range of error of most economic electoral models -- which of course to not forecast the Electoral College.
Certainly closer than my personal prediction of 49.5%, 46.0%, and 4.5% respectively, but also certainly consistent with the plodding economic expansion, and well within the range of error of most economic electoral models -- which of course to not forecast the Electoral College.
Tuesday, November 8, 2016
Economics tomorrow, civic duty today
- by New Deal democrat
Regular economic blogging, featuring the senior loan officers survey and the labor market conditions index, will resume tomorrow.
Today, after doing my civic duty, I will buy a nice bottle of red wine.
After that I plan on in-depth viewing of The Weather Channel's "Escape the Election No Coverage," with a dollop or two of the Investigative Discovery channel. A little after 9 I will check in on the Electoral Map for a bit. If the outcome isn't clear I'll tune in for a bit after 10. If it still isn't decided I will be polishing off the bottle.
See you on the other side.
Saturday, November 5, 2016
Weekly Indicators for October 31 - November 4 at XE.com
- by New Deal democrat
My Weekly Indicator post is up at XE.com. The most up-to-date data typifies an economy in Indian Summer, and forecasts a narrow win for Hillary Clinton in Tuesday's election.
Here's my prediction, FWIW:
Clinton 49.5%
Trump 46.0%
Third parties 4.5%
Friday, November 4, 2016
October Jobs report: a positive final report before the election
- by New Deal democrat
HEADLINES:
- +161,000 jobs added
- U3 unemployment rate declined -0.1% from 5.0% to 4.9%
- U6 underemployment rate declined -0.2% from 9.7% to 9.5% (new post-recession low)
Here are the headlines on wages and the chronic heightened underemployment:
Wages and participation rates
- Not in Labor Force, but Want a Job Now: down -176,000 from 6.088 million to 5.912 million
- Part time for economic reasons: down 5,000 from 5.894 million to 5.889 million
- Employment/population ratio ages 25-54:rose +0.2% from 78.0% to 78.2% (new post-recession high)
- Average Weekly Earnings for Production and Nonsupervisory Personnel: up $.04 from $21.68 to $21.72, up +2.5% YoY. (Note: you may be reading different information about wages elsewhere. They are citing average wages for all private workers. I use wages for nonsupervisory personnel, to come closer to the situation for ordinary workers.)
August was revised upward by +9,000, and September was revised upward by +35,000, for a net change of +44,000.
The more leading numbers in the report tell us about where the economy is likely to be a few months from now. These were positive.
- the average manufacturing workweek rose +0.1 from 40.8 to 40.9 hours. This is one of the 10 components of the LEI, and is a positive.
- construction jobs increased by +11,000 YoY construction jobs are up +195,000.
- manufacturing jobs declined by -9,000, and are down -53,000 YoY
- temporary jobs - a leading indicator for jobs overall - increased by 6,400 (this made a peak last December, and recently has been stabilizing).
- the number of people unemployed for 5 weeks or less - a better leading indicator than initial jobless claims - decreased by -177,000 from 2,574,000 to 2.397,000. The post-recession low was set 1 year ago at 2,095,000.
Other important coincident indicators help us paint a more complete picture of the present:
- Overtime was unchanged at 3.3 hours.
- Professional and business employment (generally higher- paying jobs) increased by +43,000 and are up +542,000 YoY.
- the index of aggregate hours worked in the economy rose by 0.2 from 105.8 to 106.0
- the index of aggregate payrolls rose 0.7 from 130.6 to 131.3 .
Other news included:
- the alternate jobs number contained in the more volatile household survey decreased by -43,000 jobs. This represents an increase of 2,728,000 jobs YoY vs. 2,357,000 in the establishment survey.
- Government jobs rose by +19,000.
- the overall employment to population ratio for all ages 16 and above declined from 59.8% to 59.7% m/m and is up +0.4% Y oY.
- The labor force participation rate fell from 62. 9% to 62.8% and is up +0.3% YoY (remember, this includes droves of retiring Bsoomers).
SUMMARY
This was a nearly perfectly positive report, With the exception of manufacturing jobs, YoY wage growth and broad labor force participation, everything else was positive across the board. Espectially positive was the new low in the U6 underemployment rate, and the increase in the prime age participation rate. One longer term caution is that the YoY change in payroll growth continues to decelerate, but there is no imminent cause for concern.
This report is probably more significant as the last piece of economic data that could affect the election. That both the unemployment and underemployment rates are lower than they were last December is particularly positive for the candidate of the incumbent party. The economic fundamentals point to a narrow (e.g., 52%/48%) Hillary Clinton victory. If the broad electorate views both candidattes as about equally distasteful, that's where I see the election result coming in.
This report is probably more significant as the last piece of economic data that could affect the election. That both the unemployment and underemployment rates are lower than they were last December is particularly positive for the candidate of the incumbent party. The economic fundamentals point to a narrow (e.g., 52%/48%) Hillary Clinton victory. If the broad electorate views both candidattes as about equally distasteful, that's where I see the election result coming in.
Thursday, November 3, 2016
Q# rents, housing, and car sales show slow consumer growth
- by Neew Deal democrat
This post is up at XE.com. Hosuing and cars are thw two most leading consumer sectors. Right now both are essentially flat, while continued high rents are pressuring consumers and virtually the only source of any inflation at all.
Bonddad's Thursday Linkfest
For those of you who follow me on Twitter, I'm moving from @captivelawyer to @originalbonddad.
I'm a Financial Adviser with Thompson Creek Wealth Advisers and an attorney with the Law Office of Hale Stewart
Total Residential and NonResidential Construction Spending

10-Year Chart of Private and Public Construction Spending as a Percent of GDP

YOY Percentage Change in Wage and Supplemental Payments Growth

YOY Percentage Change in Service and Manufacturing Wages and Salaries

ISM Up Slightly in Latest Reading

ADP Employment Report

Wednesday, November 2, 2016
The 2016 election economy: the "Bread and Peace" model final forecast
- by New Deal democrat
One of the election forecasts I have referred to frequently for the last year is the "Bread and Peace" model by Professor Douglas Hibbs. Hibbs himself has not published any forecasts for this election, but the result forecast by his model has been updated from time to time by the site "Pollyvote," which describes his model thusly:
The Bread and Peace model, developed by Douglas Hibbs, predicts the two-party popular vote based on just two fundamental variables that systematically affected post-war aggregate votes for president:
- Weighted-average growth of per capita real disposable personal income over the term, and
- Cumulative US military fatalities due to unprovoked, hostile deployments of American armed forces in foreign wars.
As of one week ago, the site forecast:
The 2016 Bread and Peace model predicts a victory for Hillary Clinton with 53.9% of the major party vote (compared to 46.1% for Donald Trump).On Monday September personal income was reported, rising +0.3%. The inflation measure rose +0.1%. But real *disposable* income for the month actually declined, so here is what real disposable personal income per capita looks like through Q3, the last measure before the election:

The deceleration in growth of real disposable personal income is evident when we look at this data YoY:

Through August, Q3 real disposable income averaged an increase of +0.2% from Q2. With September's report, that declines to less than +0.1%.
Thus the Bread and Peace model's final reading for Hillary Clinton is less than 53.9%, although above 50%.
Since August 1, poll aggregations have floated around +4% for Clinton, +/-3% depending on which candidate for whom the most recent news was awful. If the voting public concludes on average that they are about equally distasteful, then a result closer to that forecast by economic fundamentals becomes more likely.
Bonddad's Thursday Linkfest
For those of you who follow me on Twitter, I'm moving from @captivelawyer to @originalbonddad.
I'm a Financial Adviser with Thompson Creek Wealth Advisers and an attorney with the Law Office of Hale Stewart
Total Residential and NonResidential Construction Spending
10-Year Chart of Private and Public Construction Spending as a Percent of GDP
YOY Percentage Change in Wage and Supplemental Payments Growth
YOY Percentage Change in Service and Manufacturing Wages and Salaries
ISM Up Slightly in Latest Reading
ADP Employment Report
Tuesday, November 1, 2016
ISM positive, construction spending confirms flattish housing market
- by New Deal democrat
This morning we got our first October economic report. The ISM manufacturing index was again weakly positive at 51.9. The more forward looking new orders sub-index was a little bit more positive at 52.1. The new orders component in particular was about at its average for this entire year, telegraphing continued weak expansion.
So let me turn some extra attention to the report for construction spending for September. This was negative for the second month in a row, and has been essentially flat for over a year:

Although I won't put up a graph, YoY total construction spending is slightly negative at -0.2%.
When we break down construction spending into its components, it is easy to see that residential spending turns first (red in the graph below), followed by nonresidential (blue), and finally with a big lag, public construction (green right scale):

Let's take a closer look at the last couple of years. Both residential and nonresidential peaked early this year, and have declined slightly since then:

Finally, let's see how residential construction spending compares with an important leading indicator, housing starts (as usual for the last year, I am choosing this metric vs. permits because permits were greatly distorted by an NYC tax break in spring 2015):

Construction spending follows housing starts with a slight lag (although they have the virtue of being much less noisy). Starts have been going sideways for about 18 months, and construction spending followed the trend a few months later.
So I look at construction spending as simply confirming what we have seen with the longer leading indicators in the housing sector. I continue to expect a little bounce in starts as summer's low mortgage rates filter through the system. But for the foreseeable future, I expect the slightly lagging construction spending series to remain essentially flat.
My outlook differs from that of Bill McBride a/k/a Calculated Risk a/k/a the Nicest Guy in the Econoblogosphere, who expects housing to pick up in the next few years (and has been cited for that proposition by Econbrowser's Prof. James Hamilton. While I have great respect for both, my question is, if you are correct, then why has housing been so flat for the last year or more? Wan't your dynamic already in place? Why hasn't it played out in the last 12 months?
My view is that housing is driven first and foremost by interest rates, with an assist from demographics. Demographics are positive, which is why the increase in interest rates in late 2013 only made the housing sector go flat, not down. But without meaningful new lows in interest rates, history going back 60+ years says that the housing sector will remain stalled at best.
Bonddad's Tuesday Linkfest
For those of you who follow me on Twitter, I'm moving from @captivelawyer to @originalbonddad.
I'm a Financial Adviser with Thompson Creek Wealth Advisers and an attorney with the Law Office of Hale Stewart
EU Continues Moderate Growth Path

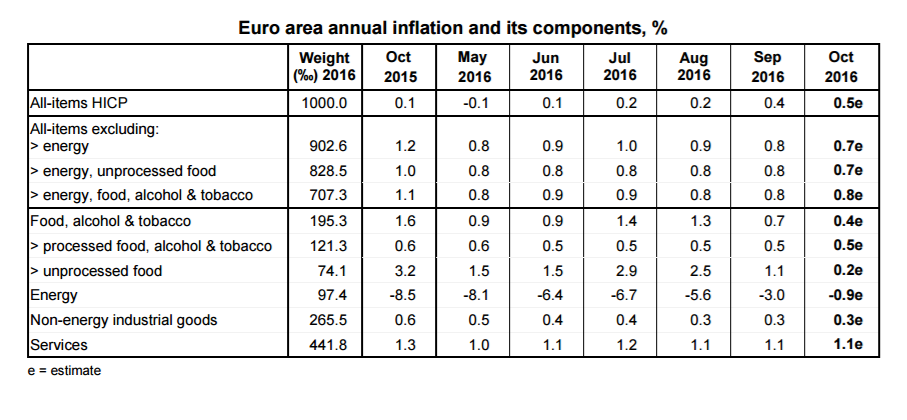
EU Inflation Picks Up a Bit Thanks to Service Prices


1-Year Charts of EU ETFs

Japanese Industrial Production and Retail Sales Continue to Disappoint


Personal income increased $46.7 billion (0.3 percent) in September according to estimates released today by the Bureau of Economic Analysis. Disposable personal income (DPI) increased $37.0 billion (0.3 percent) and personal consumption expenditures (PCE) increased $61.0 billion (0.5 percent).
Real DPI increased less than 0.1 percent in September and Real PCE increased 0.3 percent. The PCE price index increased 0.2 percent. Excluding food and energy, the PCE price index increased 0.1 percent.
1-Year Chart of Monthly Change in Durable, Nondurable and Service Spending

Monday, October 31, 2016
Bonddad's Monday Linkfest
For those of you who follow me on Twitter, I'm moving from @captivelawyer to @originalbonddad.
I'm a Financial Adviser with Thompson Creek Wealth Advisers and an attorney with the Law Office of Hale Stewart
I'm a Financial Adviser with Thompson Creek Wealth Advisers and an attorney with the Law Office of Hale Stewart
Key Charts From Friday's GDP Report
Quarterly Change in GDP

Contributions to Percentage Change in GDP

Quarterly Percentage Change in Sub-Categories of PCE Growth

Quarterly Percentage Change in Investment Growth

Building Permits and Housing Starts
Building Permits

Housing Starts

Durable Goods Orders

Case-Shiller Home Price Indexes

Sunday, October 30, 2016
Saturday, October 29, 2016
Weekly Indicators for October 24 - 28 at XE.com
- by New Deal democrat
My Weekly Indicators piece is up at XE.com. The main change is that gas prices are now UP YoY. And the wobbling continues.
Friday, October 28, 2016
Q3 GDP: a positive for the present, but ...
- by New Deal democrat
As you probably already know, real Q3 GDP was preliminarily reported at +2.9% this morning, well above expectations.
Politically, that is good news for Hillary Clinton, as the economy has accelerated to a decent pace in the last Quarter before the election -- although it suggests an improvement to a majority on the order of 52/48 vs. 51/49.
But when we look out 12+ months ahead ... well, Indian Summer is inevitably followed by the Gales of November.....
This post is up at XE.com.
Thursday, October 27, 2016
September housing: mixed signals
- by New Deal democrat
I have an updated look at housing over at XE.com.
We have a continued uptrend n new home sales, mixed signals in housing permits, and a worsening trend in mortgage applicatioins.
Bonddad's Thursday Linkfest
For those of you who follow me on Twitter, I'm moving from @captivelawyer to @originalbonddad.
I'm a Financial Adviser with Thompson Creek Wealth Advisers and an attorney with the Law Office of Hale Stewart
I'm a Financial Adviser with Thompson Creek Wealth Advisers and an attorney with the Law Office of Hale Stewart
A sharp pullback in spending by cities and states on infrastructure—from highways to sewage systems to police stations—is weighing on U.S. economic growth.
Such government austerity is unusual in the eighth year of an economic expansion, and it is acting as a headwind for economic expansion just as the worst effects of the energy-industry bust, a strong dollar and inventory drawdown are fading.
The decline in state and local investment depressed gross domestic product growth this spring and was on track to weigh on economic growth again in the third quarter.
State and Local Spending as a Percent of GDP

With the U.S. labor market at or near maximum employment, assessing trend job growth has become increasingly important. This “breakeven” rate, which is the pace of job growth needed to maintain a healthy labor market, depends primarily on growth in the labor force. Estimates that account for population aging and potential labor force participation trends suggest that trend growth ranges between about 50,000 and 110,000 jobs per month. Actual job growth has been well above this pace, implying that it can slow substantially in the future without undermining labor market health
3, 6 and 12 Month Moving Averages of Job Growth

Not least is the benefit to Social Security and other entitlement programs: in contrast to the population of labor-force age in Japan, Germany, Italy, and the United Kingdom—countries with generally older populations, lower fertility, and lower immigration—the U.S. labor-force-age population is projected to grow more than five percent between 2010 and 2030. Yet were it not for new minorities, the country’s labor force would decline by eight percent. Moreover, within the labor force, new minorities add needed youthfulness that brings with it innovation and an entrepreneurial spirit. Projections of the labor force show that in 2030, 54 percent of new minorities will be under age 40, compared to well under half of the rest of the labor force population.
Subscribe to:
Posts (Atom)