Saturday, February 15, 2014
Weekly Indicators for February 10 - 14 at XE.com
- by New Deal democrat
My Weekly Indicators column is up at XE.com.
Weakness continues, but - maybe - Here Comes the Sun.


Friday, February 14, 2014
Agricultural ETF Jumps

Since the beginning of February, the agricultural ETF has jumped a little over a point, or nearly 5% in percentage terms. Prices are now about the 200 day EMA.
Diminished rainfall in Brazil is leading to price spikes in coffee and soy beans.
Thursday, February 13, 2014
February 2014 may show the lowest YoY inflation rate in 50 years (ex-Great Recession)
-by New Deal democrat
The loosening of the Oil choke collar this winter appears to be leading to the lowest YoY inflation rate in 50 years outside of the Great Recession. I have the details up over at XE.com.
Wednesday, February 12, 2014
GM: "We're still not serious about hybrids"
- by New Deal democrat
David Atkins over at Digby's blog is upset at a YouTube commercial for a new luxury car, in which the actor portraying the owner spouts a river of entitled 1%er bile.. Atkins has since corrected the error, but he originally misidentified the ad twice as for a Chrysler, which is important from my point of view.
You see, the ad isn't for a Chrysler at all. It's for the new Cadillac ELR, a luxury hybrid that Hybrid Cars says is
a $76,000-plus compact coupe that offers nothing more than the Volt except ride, luxury, image and style.
That David didn't even know it was a Cadillac isn't surprising, since the ad copy (which he helpfully reproduces below the video) never once mentions the car's brand, or the fact that it is a bybrid.
And GM's ad agency, if they read David's post, would probably be doing high-5's. The entire point of the ad is that this guy is a total a*****e who thinks nothing of dropping $80,000 on a toy that he can't even be bothered to name, let alone describe.
In fact, he's their target buyer. Cadillac only sold 24 of the ELR's in its first month. According to Hybrid Cars,
Judging by the fictional ELR owner’s bold-as-brass attitude, and GM’s own prediction that it will not sell a lot of its new ELR, the automaker might be interpreted as saying it is just fine with the state of affairs.And that's a shame, not just for the egregiously offensive political view that is promoted, but because of what the above says about GM's commitment to hybrids and other alternately fueled vehicles.
As Edmund's test drive concluded:
While Toyota was busy turning itself into your father's Oldsmobile, GM, especially via the Cadillac CTS and Buick LaCrosse, was turning out some state of the art styling, and with the aforesaid CTS, finally hit a home run with the kind of car they once described as a "little limousine."And at the end of the day it's not that quick, not that engaging to drive. Cadillac would like us to think of the ELR as a 6 Series or Tesla Model S competitor instead of a hyper-expensive Volt, but that's how it drives, for the most part.The 2014 Cadillac ELR is stunningly beautiful from most angles. Photos truly do not do it justice. In the end, though, the 2014 Cadillac ELR displays far more show than go.
But that aforesaid CTS has disappeared from the lineup, replaced with a model carrying the same badge but really a continuation of the old STS midsize.
GM could have priced the ELR at $50,000 and sold many 10,000's of the model to luxury car drivers who actually care about fuel economy, not to mention the environment, and shown that it was the carmaker to beat in the luxury hybrid niche. Instead they have made crystal clear that the ELR is just an expensive bauble for collectors, which will undoubtedly disappear from the lineup after two or three years and sales of a few thousand. It is content to let Toyota/Lexus own the segment from the low end, and for Tesla to own it from the high end.
So the ad isn't just offensive politically. It shows that economically GM still isn't ready to do what it needs to do not to be a dinosaur.
US Market Update; Look For Small Correction Over the Next Few Days

The QQQs (top chart) have had one heck of a strong run. They've been rallying since February 5 and have rallied from 83.7 to 89. But prices have hit resistance at levels from late January and the MACD is starting to decline.


In contrast, we have the DIAs (top chart) and IWMs (bottom chart). Both have rallied over the same time period, but not as strongly and both are also hitting resistance areas.
We've had some strong upward movement over the last five days. At the same time, we're seeing prices hit resistance on a number of fronts. The cat is out of the bag on Yellen; she'll continue the easy money policies if Bernanke. And considering she's using a broader measure of unemployment, we can expect a longer period of lower rates. But over the next few days, we'll hear more of the same with added political grandstanding.
Tuesday, February 11, 2014
Oil At Important Resistance Levels

After last year's traditional summer price rally (when oil traded between 102/104 and 110/112),, prices retreated to trade between the lower 90s and 100. Now prices are again looking to breach the 100 level. Should they do so, they face little upside resistance until the 110 level.
Monday, February 10, 2014
Vietnam ETF Consolidating Recent Gains

The Vietnamese ETF has bucked the trend of emerging market sell offs of late. Prices started rallying in early September. They consolidated gains at the end of last year between the 18.5-19 price level then rallied strongly in January, moving through resistance in the upper 20s. Notice the big volume in-flow. Prices are now consolidating in a triangle pattern between 20.3 and 22.2.
Saturday, February 8, 2014
Weekly Indicators for February 3 - 7 at XE.com: The Big Chill
by New Deal democrat
My Weekly Indicators column is up at XE.com.
This was the poorest week in a long time. Is it due to the weather, at least in part, or is this real consumer weakness spreading throughout the economy?
My Weekly Indicators column is up at XE.com.
This was the poorest week in a long time. Is it due to the weather, at least in part, or is this real consumer weakness spreading throughout the economy?
Friday, February 7, 2014
US Employment : Wow, Another Weak Report.
First, I have the rather unenviable task of filling in for NDD on this issue. That does mean you'll get my somewhat different opinion about the employment report's importance. I've grown to be less and less a fan of the monthly "US employment report" release for several reasons. First, people only focus on the unemployment rate rather than the entire employment picture which includes such things as employer behavior (which is derived from the JOLTs report), employee confidence and labor utilization. Second, this report is usually revised multiple times, so the first number could be an accurate number -- or nowhere near was happening.
In addition, this report as several one off points to deal with. The first is the weather. The entire country has been hit by massive weather disruptions over the last month or so. We've seen this effect the ISM reports, housing numbers and auto sales. In addition, this report has the deal with the effects of the expiration of unemployment benefits and the annual revision to the numbers. This FT story explains this issue in more detail.
And we're off. Let's start, well, at the beginning:
Total nonfarm payroll employment rose by 113,000 in January, and the unemployment rate was little changed at 6.6 percent, the U.S. Bureau of Labor Statistics reported today. Employment grew in construction, manufacturing, wholesale trade, and mining.
.....
Total nonfarm payroll employment increased by 113,000 in January. In 2013, employment growth averaged 194,000 per month. In January, job gains occurred in construction, manufacturing, wholesale trade, and mining.
These are not wonderful numbers. First, 113,000 is simply a weak number. And the 194,000/month of growth for the last year is OK but we would do better. What is interesting is the economy was growing strongly in the last two quarters of 2013, yet the employment growth numbers were still weak.
Both the number of unemployed persons, at 10.2 million, and the unemployment rate, at 6.6 percent, changed little in January. Since October, the jobless rate has decreased by 0.6 percentage point.
The good news here is the number didn't increase. The bad news is it didn't meaningfully decrease, either. This is where I think the weather did play at least a marginal role. Let's face facts: heavy snowstorms would make is difficult to get to a job interview etc...
After accounting for the annual adjustment to the population controls, the civilian labor force rose by 499,000 in January, and the labor force participation rate edged up to 63.0 percent. Total employment, as measured by the household survey, increased by 616,000 over the month, and the employment-population ratio increased by 0.2 percentage point to 58.8 percent.
This is where some of the re-benchmarking issues come into play. The household survey number is very impressive. Also remember this household employment number tends to lead the establishment survey.
Overall job growth was fair (see tables here). There simply wasn't enough of it. This is also the third month in a row when the total number of professional service jobs added has been weak.
In January, the average workweek for all employees on private nonfarm payrolls was unchanged at 34.4 hours. The manufacturing workweek declined by 0.2 hour to 40.7 hours, and factory overtime edged down by 0.1 hour to 3.4 hours. The average workweek for production and nonsupervisory employees on private nonfarm payrolls was unchanged at 33.5 hours.
Average hourly earnings for all employees on private nonfarm payrolls rose by 5 cents to $24.21. Over the year, average hourly earnings have risen by 46 cents, or 1.9 percent. In January, average hourly earnings of private-sector production and nonsupervisory employees increased by 6 cents to $20.39.
The hours worked decline is disappointing. However, the 5 cents/hour increase is good news. But -- just to throw a cold blanket on that number -- hourly earnings only increased 1.9% over the last 12 months.
The market view this report as disappointing. However, I would add the important caveat that here the weather is probably playing a role in the slowdown.
NDD will add his comments later today.
In addition, this report as several one off points to deal with. The first is the weather. The entire country has been hit by massive weather disruptions over the last month or so. We've seen this effect the ISM reports, housing numbers and auto sales. In addition, this report has the deal with the effects of the expiration of unemployment benefits and the annual revision to the numbers. This FT story explains this issue in more detail.
And we're off. Let's start, well, at the beginning:
Total nonfarm payroll employment rose by 113,000 in January, and the unemployment rate was little changed at 6.6 percent, the U.S. Bureau of Labor Statistics reported today. Employment grew in construction, manufacturing, wholesale trade, and mining.
.....
Total nonfarm payroll employment increased by 113,000 in January. In 2013, employment growth averaged 194,000 per month. In January, job gains occurred in construction, manufacturing, wholesale trade, and mining.
These are not wonderful numbers. First, 113,000 is simply a weak number. And the 194,000/month of growth for the last year is OK but we would do better. What is interesting is the economy was growing strongly in the last two quarters of 2013, yet the employment growth numbers were still weak.
Both the number of unemployed persons, at 10.2 million, and the unemployment rate, at 6.6 percent, changed little in January. Since October, the jobless rate has decreased by 0.6 percentage point.
The good news here is the number didn't increase. The bad news is it didn't meaningfully decrease, either. This is where I think the weather did play at least a marginal role. Let's face facts: heavy snowstorms would make is difficult to get to a job interview etc...
After accounting for the annual adjustment to the population controls, the civilian labor force rose by 499,000 in January, and the labor force participation rate edged up to 63.0 percent. Total employment, as measured by the household survey, increased by 616,000 over the month, and the employment-population ratio increased by 0.2 percentage point to 58.8 percent.
This is where some of the re-benchmarking issues come into play. The household survey number is very impressive. Also remember this household employment number tends to lead the establishment survey.
Overall job growth was fair (see tables here). There simply wasn't enough of it. This is also the third month in a row when the total number of professional service jobs added has been weak.
In January, the average workweek for all employees on private nonfarm payrolls was unchanged at 34.4 hours. The manufacturing workweek declined by 0.2 hour to 40.7 hours, and factory overtime edged down by 0.1 hour to 3.4 hours. The average workweek for production and nonsupervisory employees on private nonfarm payrolls was unchanged at 33.5 hours.
Average hourly earnings for all employees on private nonfarm payrolls rose by 5 cents to $24.21. Over the year, average hourly earnings have risen by 46 cents, or 1.9 percent. In January, average hourly earnings of private-sector production and nonsupervisory employees increased by 6 cents to $20.39.
The hours worked decline is disappointing. However, the 5 cents/hour increase is good news. But -- just to throw a cold blanket on that number -- hourly earnings only increased 1.9% over the last 12 months.
The market view this report as disappointing. However, I would add the important caveat that here the weather is probably playing a role in the slowdown.
NDD will add his comments later today.
Thursday, February 6, 2014
Wednesday, February 5, 2014
Japanese ETF Breaks Two Key Support Areas

The Japanese ETF has broken support in both the lower 11's and the 200 day EMA. This move was telegraphed by the slowing declining MACD over the last 6 months.
Tuesday, February 4, 2014
Most "Problem" Emerging Economies Have Inflationary Problems
While inflation does not explain all of the problems faced by these countries, it is clearly a contributing problem. And considering the most of these countries also have high unemployment, we can conclude there are systemic issues at work.
Read more over at XE.com.
Read more over at XE.com.
Yes, It's A Correction. No, You Shouldn't Panic
The markets have been selling off since the beginning of the year. Considering equities have been rallying strongly for most of last year, and that money managers poured money into the market at the end of the year to dress up their numbers, some reactionary sell-off was warranted. And no, it's not time to panic.
First, let's look at the 30 minute chart:

We see two strong sell-offs. The first is through the 181.31 level of support and the second is through the upper 176/lower 177 level. Both sell-offs have been strong and occurred on higher than usual volume. From peak to trough, the overall sell-off is from about 184 to 14 or a loss of almost 6%.

Above is a chart of the daily price action. Prices are now at important Fib levels as well as the 200 day EMA -- a very important technical point. The sell-off has obviously hit momentum and increased volatility (increased Bollinger Bands).
But, even if prices move below the 200 day EMA, it will most likely be the result of an overly aggressive selling instinct. While we are reading reports about traders being concerned with economic growth, remember we are seeing weaker numbers partially because of weather-related factors. Once we thaw out, I would expect a return to more consistent, positive numbers.
First, let's look at the 30 minute chart:
We see two strong sell-offs. The first is through the 181.31 level of support and the second is through the upper 176/lower 177 level. Both sell-offs have been strong and occurred on higher than usual volume. From peak to trough, the overall sell-off is from about 184 to 14 or a loss of almost 6%.
Above is a chart of the daily price action. Prices are now at important Fib levels as well as the 200 day EMA -- a very important technical point. The sell-off has obviously hit momentum and increased volatility (increased Bollinger Bands).
But, even if prices move below the 200 day EMA, it will most likely be the result of an overly aggressive selling instinct. While we are reading reports about traders being concerned with economic growth, remember we are seeing weaker numbers partially because of weather-related factors. Once we thaw out, I would expect a return to more consistent, positive numbers.
Oil At Critical Resistance Levels

Oil has been trading between the upper 90s and 100 area for the last four months. However, prices have again risen to the key resistance area of ~100. Also note that prices are now about all the EMAs -- including the 200 day EMA.
Monday, February 3, 2014
If consumers can't buy, and can't refinance, a recession follows
- by New Deal democrat
It's not too often when the Progressive point of the day coincides exactly with something wonky I was going to say, but well, today is such a day.
From the New York Times via Charlie Pierce and Atrios, we learn that
As politicians and pundits in Washington continue to spar over whether economic inequality is in fact deepening, in corporate America there really is no debate at all. The post-recession reality is that the customer base for businesses that appeal to the middle class is shrinking as the top tier pulls even further away.In the 4th quarter of 2013, consumers only got a little help. We got two reports on median wages in the last couple of weeks.
First came the Census Bureau's report os usual weekly wages:
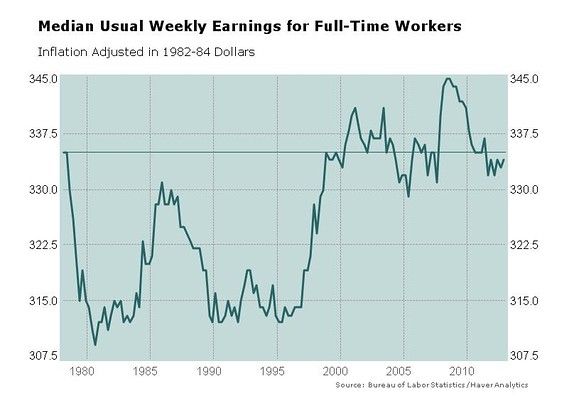
Usual weekly wages went up $1 adjusted for inflation in the 4th quarter. The post-recession bottom was in the 3rd quarter of 2012 and the 1st quarter of 2013. Usual weekly wages have stagnated since the end of the tech boom, now nearly 15 years ago. The big jump during the recession is when gas prices fell from $4.25 a gallon to below $1.50 a gallon, and the decline from 2009 through 2012 was gas prices going right back up to nearly $4 a gallon again.
Last week the Employment Cost Index was reported. This is another median measure. In nominal terms, median wages rose over 2% for the first time in over 4 years:
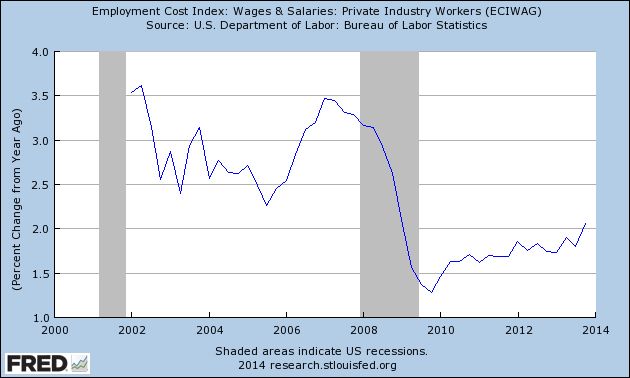
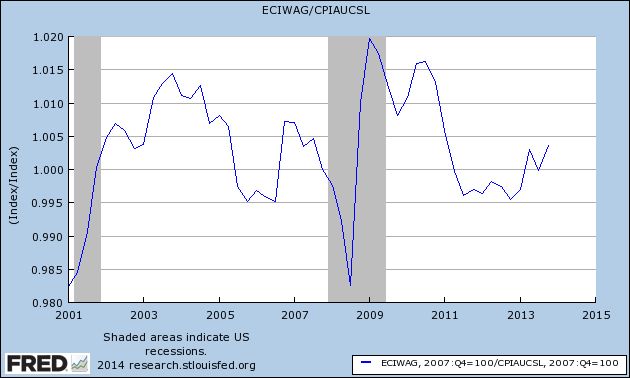
Adjusted for inflation, in 2013 median wages rose about 0.5% from 2012, and were at about 2007 levels. But note they are still below their 2008 levels, let alone their levels a decade ago in 2002--04
.
Which brings me to my reminder that the middle class being unable to refinance due to either a rising asset price like their house, or due to lower interest rates for at least 3 years, has been a precursor to recession:
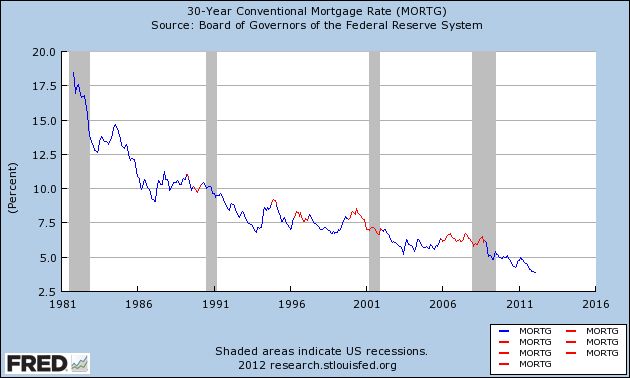
Interest rates made a likely once-in-a-liefetime low in July 2012, over 18 months ago, and as this graph from Mortgage News Daily shows, refinancing has dried up:
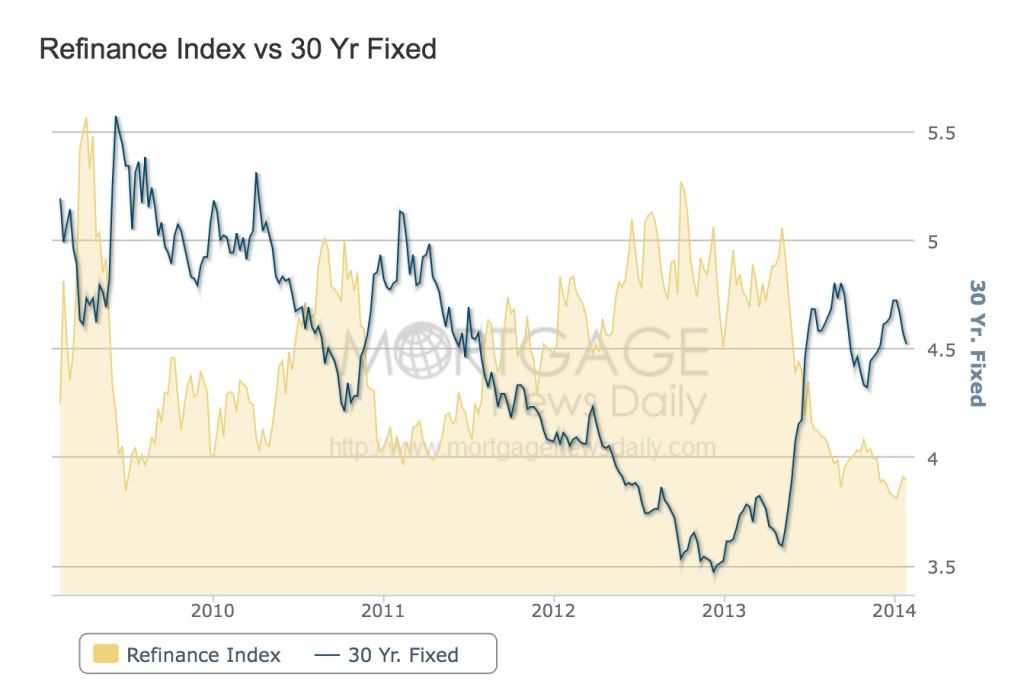
As much as Pierce, Atrios and other progressives dislike the current situation, imagine a new recession and X millions more Americans losing their jobs. That we will have an incomplete recovery before that happens is my biggest fear.
Subscribe to:
Posts (Atom)