Monday, March 18, 2013

Morning Market Analysis

For the first few months of this year, I have found the actual state of the equity markets to be incredibly hard to determine.  The biggest analytical headache has been the Fed's QE program -- a program which I support from an economic perspective.  The problems caused by this program relate to its effects on the theoretical "natural flow" of money that occurs throughout the business cycle. First, when the equity market starts to rally, the bond market (which should rise during the recession and should hold those gains for the first part of the recovery) should sell off after traders realize the the economy is growing.  At this stage of the recovery the equity market should provide a better rate of return than the bond market.  This bond market sell-off does not happen under the QE program as there is always a bid under the treasury market.  Additionally, low yields in the treasury market means investors will look to other areas of the market for fixed-income like returns: hence defensive market segments like utilities (the XLU is currently yielding 3.86) and consumer staples (which is currently yielding  2.8%) have also been rallying when they should be selling off to a certain extent.

Put more succinctly, my natural market cues for a stronger recovery have been masked by the Fed's program, leading me to mis-diagnose the current state of the market which is clearly rallying.  I should also add that there is now evidence that the economy is in fact stronger than I first thought, a point which I'll make later today.

This is very clearly evidence from the P&F chart:

The general upward trend is very clear.  In addition, notice how prices have been clearly moving through resistance at a regular clip.

Also consider this monthly chart of the SPYs:


The rally from 2009 has been interesting.  First, notice that the rate of increase (the percentage rise) for each leg continually decreased.  The first leg up shows an increase of about 67.5%, the second leg shows an increase of 35% and the third leg shows an increase of 28.4%.  This movement implied that when the SPYs hit resistance around the 142 level, they'd stall or consolidate for far longer -- a conclusion bolstered by the weakening MACD and the economic event of the sequester and the payroll tax hike.

However, we haven't seen prices consolidated.  Instead, we see a sell-off that lasts for a few weeks (roughly the end of February and early March) which is then followed by new highs.

Finally, notice the trend line started in 2009 is still firmly intact.


Also notice how the IWMs mirror the SPY analysis, with the exception of the symmetrical triangle at the top of the latest rally.


Sunday, March 17, 2013

Weekly Indicators: Real M2 money supply a new area of concern edition


 - by New Deal democrat

Monthly data released in the past week included strongly positive retail sales, even after gasoline-dominated inflation was taken into account. Industrial production and capacity utilization also rose strongly. The Empire Sate Manufacturing report was positive. On the negative side, business inventories increased and consumer sentiment, especially forward-looking expectations soured. The latter is most likely due to the ongoing sequester and latest "grand bargain" machinations in Washington.

Let me remind readers that this look at high frequency weekly data is not predictive, but attempts to capture the most up to the minute pulse of the economy in the present. As I've done for the last few weeks, due to the recent payroll tax increases, let's start again this look at the high frequency weekly indicators by checking what is happening with tax withholding:

Employment metrics

Daily Treasury Statement tax withholding

  • $153.1 B (adjusted for 2013 payroll tax withholding changes) vs. $163.1 B, -6.1% YoY for the last 20 days.  The unadjusted result was $176.1 B for an 8.0% increase.
Initial jobless claims
  •   332,000 down 8,000

  •   4 week average 346,750 down 2,000
American Staffing Association Index
  • up 1 to 91 w/w up 3.6% YoY
Employment metrics were positve this week, with the ongoing quandary as to what is happening with tax withholding.  Initial claims have established a new lower range of between 330,000 to 375,000.  The ASA is still running slighty below 2007, and slightly ahead of last year.

To reiterate, I am adjusting my YoY tax withholding figures to reflect the increase in personal withholding taxes. While the YoY collections are up substantially, they should be up over 15% to compensate for the tax increase.  Since I can think of no reason why employment itself should have fallen off a cliff in January, it is very possible that there is a lag in the payment of withholding taxes with the new increase.  If this hypothesis were correct, I would have expected tax withholding to be much more reliable by about now. So far, that isn't happening.

Consumer spending Gallup has been very positive for 3 months. After tailing off in late February, there has been another splurge of spending in March.  The ICSC varied between +1.5% and +4.5% YoY in 2012. with one excpetion, the report for the last few weeks has been near the bottom of this range.. The JR report this week is in the middle of its typical YoY range for the last year.  Even in the worst case, it still looks like consumer spending has not collapsed due to the tax withholding increase. The rebound in the last several weeks may be due to tax refunds finally arriving in consumers' hands.

Housing metrics

Housing prices
  • YoY this week. +5.0%
Housing prices bottomed at the end of November 2011 on Housing Tracker, and have averaged an increase of +2.0% to +2.5% YoY for the last year. For the fifth week in a row, this week was the best YoY comparison in about 7 years.

Real estate loans, from the FRB H8 report:
  • -0.2% w.w

  • unchanged YoY

  • +2.2% from its bottom
Loans turned up at the end of 2011 and averaged about 1% gains YoY through most of 2012.  In the last month these have stalled.

Mortgage applications from the Mortgage Bankers Association:
  • -3% w/w purchase applications

  • +9% YoY purchase applications

  • -5% w/w refinance applications
Purchase applications had been going sideways for 2 years. In the last couple of months they have finally broken out of that range - slightly - to the upside.  Refinancing applications were very high for most of last year with record low mortgage rates, but did decreased recently with an increase of mortgage rates. In the last week, mortgage rates declilned again, and refinancing went up.

Interest rates and credit spreads
  •  4.85% BAA corporate bonds up 0.08%%

  • 1.96% 10 year treasury bonds up 1.96%

  • 2.89% credit spread between corporates and treasuries unchanged
Interest rates for corporate bonds have generally been falling since being just above 6% two years ago in January 2011, hitting a low of 4.46% in November 2012.  Treasuries have fallen from about 2% in late 2011 to a low of 1.47% in July 2012. Spreads have varied between a high over 3.4% in June 2011 to a low under 2.75% in October 2012.  The  last several months have seen a marked increase in rates and credit spreads have widened.

Money supply

M1
  • +0.1% w/w

  • -0.8% m/m

  • +9.4% YoY Real M1

M2
  • +0.1% w/w

  • -0.8% m/m

  • +4.6% YoY Real M2
Real M1 made a YoY high of about 20% in January 2012 and has generally been easing off since.  This week's YoY reading remained above a new low set several weeks ago.  Real M2 also made a YoY high of about 10.5% in January 2012.  Its subsequent low was 4.5% in August 2012.  It was weak once again this week. In absolute terms, M2 made a high over 2 months ago and is down -0.7% from that peak. The behavior of M2 thus bears close scrutiny.

Oil prices and usage
  •  Oil $93.45 up $1.50 w/w

  •   gas $3.71 down $0.05 w/w

  • Usage 4 week average YoY +1.1%
The price of a barrel of Oil has backed off recent seasonal highs, and is actually down YoY.  Unusually for the last year plus, the 4 week average for gas usage for the sixth week in a row was positive YoY.  This may be due to winter weather having been actually winter-like this year.

Transport

Railroad transport from the AAR
  •  -2500 or -0.9% carloads YoY

  • +500 or +0.4% carloads ex-coal

  • +9,000 or +4.0% intermodal units

  • +6600 or +1.3% YoY total loads
Shipping transport Rail transport appears to have returned to its pattern from last year.  The Harpex index remains slightly off its 3 year low of 352, and the Baltic Dry Index remains above its recent low.

Bank lending rates The TED spread increased slightly from its 18 month+ low.  LIBOR remained at its new 52 week low and is close to a 3 year low.

JoC ECRI Commodity prices
  • up 1.35 to 128.09 w/w

  • +1.61% YoY
As I said lasst week, I am really not sure what to make at all at this point of tax withholding. Unadjusted of course it is running very well above last year. But it should be about 15% higher, after adjusting for the payroll tax increase, not 10%, and we are now more than 2 months into the year. ICSC consumer spending came in rather weak, but Johnson Redbook is in its usual YoY range. Meanwhile, Gallup consumer spending, after a pause, is back on a tear. It's worth emphasizing that once again Gallup has stood out from the rest as accurately predicting monthly retail sales and overall economic activity.

Relatively weak comparisons included real estate loans and bank credit rates and spreads. Of more concern is that M2 money supply, a historically important component of the LEI, has declined since the first of the year.

In addition to Gallup consumer spending, other continuing positives once again include housing prices and mortgage applications. Bank lending rates remain positive.  Gas usage remains positive, and Oil prices are more accomodating. Initial claims are very positive. Rail traffic was also generally positive again.

Only tax withholding adjusted for increased rates, plus real M2 measured from the beginning of this year are outright negative. To reiterate my conclusion from lat week, many of the others are less positive than they used to be, and are close to neutral. Thus I remain more cautious than in recent months.

Have a nice weekend.

Friday, March 15, 2013

Weekend Weimar, Beagle and Pitbull

It's that time of the week again.  I'll be back on Monday, NDD will be here over the weekend.  Until then ...


Expansion continues: real retail sales, industrial production up in February


- by New Deal democrat

In recent years, consumer price inflation has been almost all about gasoline prices. Back out energy price changes, and overall CPI is almost identical to "core" CPI. Core CPI has been running at about +0.1% or +0.2% a month for years now. Almost all of the difference is based on the change in what drivers pay for gasoline at the pump. You can see this in the below graph. Note that core inflation (green) and all inflation except for energy (blue) are almost always close to identical. It is only when energy is added, giving us total inflation (red) that the numbers change significantly:


(Update: just so the point is clear, "core" inflation is overall inflation minus food and energy. The above is to demonstrate that it is energy, not food, that is the driver of the difference).
That was certainly true of this morning's CPI release for February, showing that "core" inflation was up +0.2%, while overall inflation was up +0.7%. The BLS acknowledged as much, saying that"gasoline ... account[ed] for almost three-fourths of the seasonally adjusted all items increase." Since February one year ago saw an increase of only +0.3% in consumer prices, the YoY inflation rate increased to +2.0%. As you probably already know from your trips to the gas pump, this month so far gasoline prices have actually declined, so last year's March +0.3% increase in CPI may be wiped out, causing YoY inflation to retreat again.

The price of gas is what I have been calling the "Oil choke collar," and I believe it is a prime reason behind the good data we seem to get every winter and early spring vs. the poor data we get in the summer.

That pattern has repeated itself this winter. As Bonddad pointed out yesterday, nominal retail sales grew at +1.1% in February, blowing away estimates. Retail sales ex-gas were also up substantially. Now that we have the February inflation report, we know that real retail sales increased by +0.4% in February, the fourth increase in a row. Real retail sales are up about 4% since July of last year, the month that ECRI has been declaring was the peak for this business cycle, as shown on this graph:


It has to be said that once again, Gallup's daily report of consumer spending has been the most accurate real-time barometer of consumer spending. While other measures were tepid or faltering, this report showed that consumers were powering right through the "fiscal cliff" and the payroll tax increases, at least so far.

If you are looking for a negative, then although it received little attention, the Manufacturing and Trade Sales report for January was also released this past week, and it showed a month-over-month decline from December of -0.3%, even before inflation is factored in. While CPI is not the inflation adjustment for this series, if we make use of it as a back-of-the-envelope estime, that means that "real broad sales" declined about 1% from December into January.

Which brings us to Industrial Production, which also increased +0.7% in February, with January being revised up from -0.1 to 0.0. Industrial production has now risen for 3 of the last 4 months, and in all of the last 4 months has been above its reading from July of last year, once again demolishing the claim by ECRI that July was the peak of this business cycle, as shown on the below graph in which the pre-recession peak of industrial production is set to 100:


This new peak is not just a post-Sandy bounce and cannot be a pre-fiscal cliff anomaly, coming as it does 2 months later. (Update: We have industrial production data going all the way back to 1919. Industrial production has never risen more than two months into a recession, by a maximum of +0.3, in 1990. The idea that industrial production could still be rising 7 months into a recession and be higher by +1.6% is, um, novel to say the least.)

With nonfarm payrolls, aggregate working hours, real retail sales, and industrial production all setting new highs, it is pretty clear that the economic expansion continued through last month. With gas prices somnolent so far this month, there's a good bet that this month will show growth as well.

Household deleveraging continues, hits new record low


-by New Deal democrat

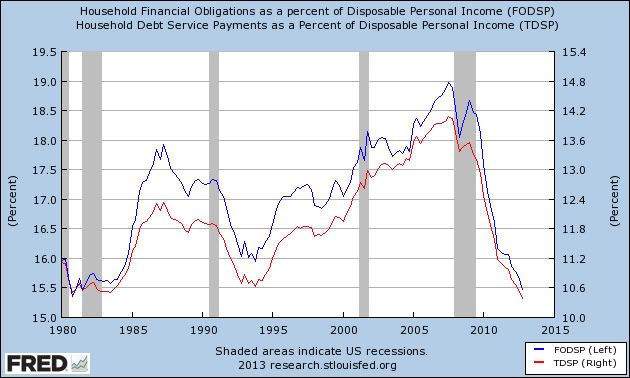
The Federal Reserve's report on household debt burdens was released Wednesday covering the October - December quarter. and after 5 years of rapid decline, one of the two series set a new record low.

According to the bank,
The household debt service ratio (DSR) is an estimate of the ratio of debt payments to disposable personal income. Debt payments consist of the estimated required payments on outstanding mortgage and consumer debt.

The financial obligations ratio (FOR) adds automobile lease payments, rental payments on tenant-occupied property, homeowners' insurance, and property tax payments to the debt service ratio.
I've combined the two measures into a single graph:


Total financial onligations (blue line) are now less than at any time since 1982. More impressively, debt service payments (red line) have established a new all-time record low.

Last year CNBC reported that :
U.S. home owners are refinancing their mortgages at the fastest clip since 2005, but the difference now is they are putting cash in, not taking it out.

At the going rate, 25 percent of all first-lien U.S. mortgages will be refinanced this year, according to LPS Applied Analytics. That represents about $7.1 billion —just through June of this year — in savings on monthly payments, according to economists at Freddie Mac, who ran the numbers for this report.
This equates to about 0.6% of all retail spending per month.

I long suspected that, before this cycle was over, households would set new all time lows for debt service. That has now happened for debt service payments, and is likely to happen as to total financial obligations in the next two reports. As I have noted a number of times, refinancing has increased in the last year or so with new record lows in mortgage rates, and has probably played a major role in keeping the economy from tipping back into recession.

Morning Market Analysis


Yesterday, the UK ETF was one of the best performing ETFs of those I watch; notice the incredibly strong bar it printed (top chart).  This is a very impressive move, especially considering this ETF has been a dramatic underperformer for the last 4-5 weeks on multiple time frames.  For the last week, the candles have been tangled with the shorter ETFs.  However, yesterday market a strong break-out. 

However, notice on the weekly chart (bottom chart) that for most of this year, prices have been consolidating, falling back to the long-term trend line.  Now we see prices rebounding from that level and approaching a multi-year high.


In addition to a rallying equity market, the British Pound also rallied strongly, moving through the 10 day EMA and upside resistance. 


The Peruvian ETF is at important technical levels.  After reaching the 48 level in mid-January, prices slowly started to sell-off.  Now, prices are just below the 200 day EMA which is also right above the lower 43 price level -- a technically important level.  In addition, notice the declining MACD, negative CMF reading and heightened volume. 


Finally, the Russell 2000 ETF rebounded through resistance yesterday.  Notice the MACD and CMF buy signals as well.

Thursday, March 14, 2013

US Retail Sales Increase Sharply

From the Census Bureau:

The U.S. Census Bureau announced today that advance estimates of U.S. retail and food services sales for February, adjusted for seasonal variation and holiday and trading-day differences, but not for price changes, were $421.4 billion, an increase of 1.1 percent (±0.5%) from the previous month and 4.6 percent (±0.7%) above February 2012. Total sales for the December 2012 through February 2013 period were up 4.5 percent (±0.5%) from the same period a year ago. The December 2012 to January 2013 percent change was revised from +0.1 percent (±0.5%)* to +0.2 percent (±0.3%)*.

Let's look at some of the data:


The chart above shows that without autos, retail sales increased 1% last month,  In addition, autos sales increased 1.1% -- a strong showing and a very important development.  Consider the following chart:


Above is a scatterplot chart graphing the year over year percentage change in real retail sales with real GDP.  What we see is that when real retail sales increase on a year over year basis, the year over year percentage change in real GDP will probably be positive as well.  I've averaged the monthly retail sales numbers into quarterly numbers to coordinate them with the quarterly GDP numbers.

Unfortunately, we only  have about 20 years of real retail sales data.  But of the data we do have, we see a strong correlation.


The chart above is simply for total retail sales, which clearly continue to rise.

This number bodes very well going forward.


Is It Time to Short Canada?

Last Thursday, the blog Sober Look At the Markets had a post up on why Canada is in trouble.  They cited six reasons:

1.) They depend on energy exports to the US.  With the US now ramping up production, we need less Canadian energy.
2.) A strong currency has curbed exports.
3.) The housing market is overvalued
4.) Unit labor costs in manufacturing are high
5.) Mexico is now the leading exporter to the US
6.) They have a large current account deficit.

FT had an article last week that highlighted the problems in the consumer market and the real estate market.  Consider this chart from the article:


The top left chart of housing prices looks like the US housing price chart before the crash.  And the continued increase in household debt does not bode well for the future.  Remember that one of the reasons for the slow pace of the US recovery is that consumers are paying down debt which is slowing their spending.  At some point, Canada will undergo the same situation, leading to a long-slow period of growth.

The IMF has been warning about the Canadian market for some time.  Form the same article:

House prices, meanwhile, rose 23 per cent in the three years to April 2012. The International Monetary Fund has been warning since 2011 that Canadian homes looked overvalued, because the ratios of house prices to incomes and to rents were respectively 20 per cent and 29 per cent above their long-run averages.
And consider the slow pace of Canadian growth, as shown in the following chart:


For the last five quarters, Q/Q growth rate has been at the most .5% -- very slow.

And the annual pace of growth is slowing:

Real GDP expanded 1.8% in 2012 after growing 2.6% in 2011. Final domestic demand was up 1.9%, following a 2.7% increase in 2011. 

Finally, consider the lop-sided nature of domestic investment:

Business investment in residential structures advanced 5.8% in 2012, three times the pace (+1.9%) set one year earlier. New home construction was up 12.8%. On the other hand, business investment in plant and equipment (+6.2%) grew at a slower pace compared with one year earlier (+10.4%). 

It appears that our neighbors to the north are starting to have some fairly serious problems.

Initial claims remain a bright spot


- by New Deal democrat

Initial claims were reported at 332,000 this morning. This is the third time this year that initial claims have come in at 335,000 or less, which is the upper limit of claims I would expect in a normal expansion. At 346,750, this is also the lowest 4 week average of claims since 5 years ago in March 2008.

Last year claims stalled at a lower limit of 360,000. We have now had 11 straight weeks of data under that point.

I realize that the improvement in the economy is way too slow and has been way too slow since it started going on 4 years ago. But it is certainly better than contraction, and there has never, ever, ever been an economic contraction that wasn't preceded by a substantial increase in initial jobless claims.

The fact that layoffs are running only a hairbreadth above what we would expect in a strong economy remains about the brightest spot of data in the landscape.

Morning Market Analysis


The return of the dollar has been the story in the currency markets over the last month.  The top chart shows the dollar's performance relative to the other major reserve currencies except the yen (which has been in a clear bear market).  Notice how the dollar started to really outperform about a month ago; all other currencies are in negative territory.  On the daily chart (middle chart) we see the dollar has moved through two areas of resistance, one at about 22.05 and the second just above 22.2.  Since then we see a strong rally.  On the weekly chart (bottom chart), the dollar is right below the 200 week EMA.  If if moves through that level, there is a fair amount of open chart space to the highs from late last summer.


The Vietnamese ETF bears a striking resemblance to the Chinese market ($SSEC; see chart from yesterday).  After moving lower for most of last year, prices pushed sharply higher starting in late November, early December.  They pushed through resistance in the 18.5 and the upper 20s before topping in the 23.5 area.  They have since pulled back to the 50 day EMA, pulling the 10 and 20 day EMA lower as well.


The two chart above are offered for contrast.  The financial sector (top chart) is clearly one of the areas driving the market rally.  Despite a brief dip at the end of February, price have been on the same upward trajectory since the middle of November.  In contrast we have the technology sector (bottom chart) which has been a clear laggard.  It's the worst performing US sector over the last year and six month time periods, and it's performance over shorter periods is only marginally better.

Wednesday, March 13, 2013

Flow Of Funds Data Overview

Last week, the Federal Reserve issued the Flow of Funds report, which provides a good overview of the underlying financial situation in the US.  Here are a few charts to highlight some trends.

First, the good news:


Mortgage debt has been decreasing since just before the recession started, indicating that consumers are dealing with the effects of the housing bubble.  On the other hand:


Consumer credit is now at its highest level ever.

However, total consumer debt payments as a percent of total disposable income are at low levels:


Finally, household net worth is at its highest level since the recession ended:


Brazil's Bank Takes Hawkish Inflation Tone

Back in early February, I noted that several BRIC countries have an inflation and growth problem.   While none are at stagflation levels, we starting to see movements in that area.  On that point, some commentators are arguing that the new policy statement from the Bank of Brazil is giving the bank room to possibly raise rates.  First, here is the statement from the bank, which was released last week:

Brasília - Assessing the macroeconomic outlook and the inflation prospects, the Copom unanimously decided to maintain the Selic rate at 7.25 percent, without bias. The Committee will monitor the evolution of the macroeconomic scenario until its next meeting, in order to define the next steps in its monetary policy strategy.

The Financial Times notes that some people are interpreting this statement hawkishly:

But in the accompanying statement, for the first time since August 2011, it left open the possibility of an increase to tackle rising inflation.

This represented a sharp turnround from previous statements that rates would remain low for a “prolonged period”, leading economists to predict central bank president Alexandre Tombini could increase them as early as next month.

“To me it was very clear, he is signalling the intention to hike is there, the decision has already been made,” said Marcelo Salomon, economist with Barclays Capital.

The reason for the possible change in tone is Brazil's inflatioin projections continue to print at level just above the banks comfort zone

Brazilian consumer prices ended 2012 near the top of the central bank’s target range for the third year running, prompting concern from economists that the country is stuck in a phase of low growth and high inflation.

Brazilian inflation in December was 5.84 per cent against a year earlier – well above the middle of the central bank’s target zone of 4.5 per cent plus or minus two percentage points – despite economic growth last year that was estimated to have been only about 1 per cent.

Morning Market Analysis


Last week, the Brazilian ETF was one of the best performing international ETFs of the group I watch. The top chart shows that prices gapped higher, eventually hitting the 57-5t.5 area.  The lower chart places this move in a longer, year-long context.  Prices are near the top of their trading range after the sharp fall last spring.

At this point, it's important to remember the fundamentals of the Brazilian economy: GDD growth is slowing and inflation is picking up.  The underlying fundamentals aren't conducive to a strong move higher right now.


After rallying about 25% from the beginning of December to the beginning of February, the Chinese market has been weakening, dropping almost 6.5%.  Prices are now around the 50 day EMA, and the shorter EMAs are are moving lower.  Also note that prices are weakening and momentum is declining.  Finally, an argument could be made that recent prices action is forming a head and shoulders top.


The consumer discretionary sector is powering higher.  The year long daily chart (top chart) shows that prices have moved through two key areas of resistance over the last year: 48 and 51.  The move through 48 was very important as this price level provided resistance for over 4 months. 

The lower chart shows the weekly chart, which is even more impressive.  Prices have been moving strongly higher for over a year.


Tuesday, March 12, 2013

Is the Japanese Outlook Getting Brighter?

Consider the following chart, which polls the attitudes and opinions of domestic businesses regarding the domestic economy:


 Oct.-Dec.
2012
(previous)
 Jan.-Mar.
2013
(present)
 Apr.-Jun.
2013
(outlook)
 Jul.-Sep.
2013
(outlook)

Corporations with capital of 1 billion yen or over
All industries -18.7 17.9 15.8 12.2
 Manufacturing -20.8 11.3 13.8 11.6
 Non-manufacturing -17.6 21.5 16.9 12.6
Corporations with capital of 100 million to 1 billion yen
All industries -23.9 9.6 14.8 12.8
 Manufacturing -27.8 -1.0 11.1 14.7
 Non-manufacturing -22.8 12.8 15.9 12.3
Corporations with capital of 10 to 100 million yen
All industries -32.1 -2.7 9.2 8.6
 Manufacturing -38.4 -10.0 4.9 7.7
 Non-manufacturing -30.9 -1.2 10.1 8.8

Notice the big jump from low negative numbers (-18.7) to decent positive numbers (17.9) from big industries.  We see similar improvement in the mid-size and small company categories.

Consider the above information in the context of the Japanese ETF:


 Prices bottomed in mid-late November and have been rising since.  Prices moved through resistance at the 10-10.1 area in late February.  The EMA picture is very positive, as are the underlying technical indicators.

Are workers winning the battle of deleveraging vs. deflation?


- by New Deal democrat

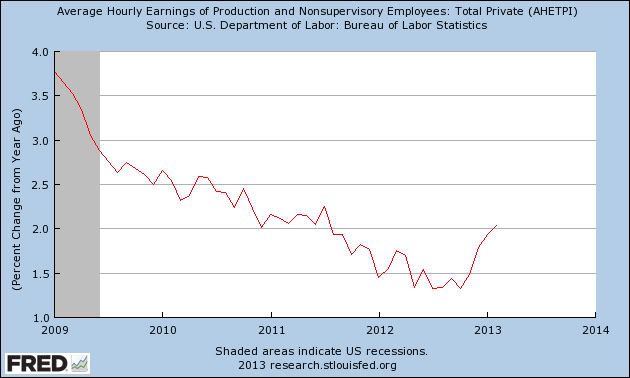
One of the important issues I've written about a number of times in the last few years is the battle of consumer debt deleveraging vs. wage stagnation. Even at the beginning of the 2008-09 recession, wages were still growing at about 3% a year. Yet in late 2012, despite the economy being in recovery for over 3 years, wages hadn't kept pace in real terms, with nominal wage growth declining to about 1.5% a year.

Thus, even a very mild consumer price inflation of 2% left workers behind. My fear has been that we would have almost complete wage stagnation at the start of the next recession, whenever that would be. We barely escaped wage deflation in 2009; it would be extremely difficult to escape it in the next downturn.

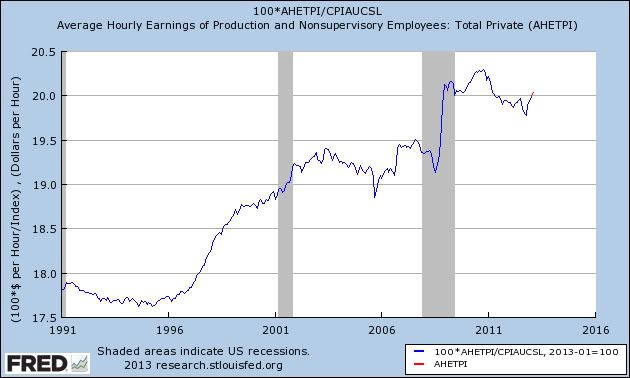
In the last few months, that has changed. The change in YoY wages has increased to over 2% a year, while inflation has decreased to 1.6% YoY, giving workers their first significant improvement in over five years:


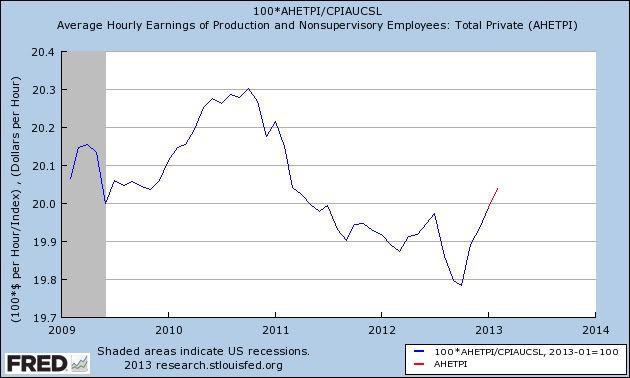
Not only that, but as you can see from the next graph, real hourly wages (average hourly wages divided by the CPI) are now as high as they were two years ago as well.


Needless to say, this is welcome news.

And while you can count me as very surprised that it happened in the presence of a 7.7% unemployment rate, there's a reasonable chance it's not fluke, it's for real.

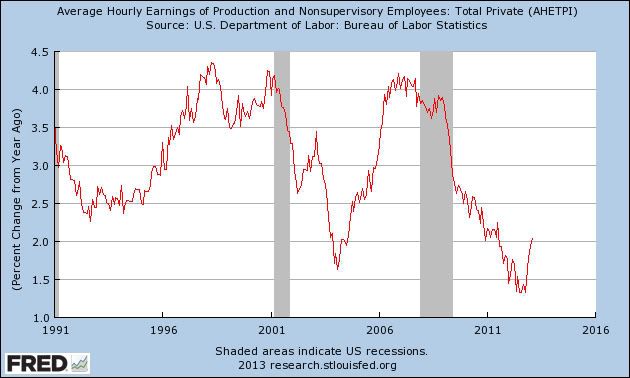
Here's the same graph of average hourly wages for the last 20 years:


As you can see, similar sharp reversals happened in both the mid 1990's and mid 2000's - although with one false positive in 2002.

The pattern also shows up when we back out and examine real hourly wages over the last 20 years:


Note that over this time span, real hourly wages have typically risen either during recessions or at about mid-cycle. During recessions they rise because, while growth in average wages are decelerating, inflation is decelerating even more (or even turning into deflation) due to the economic weakness, i.e., producers aren't able to pass on price increases, and may have to cut prices. In mid-cycle they tend to happen as employers raise wages to attract more talent.

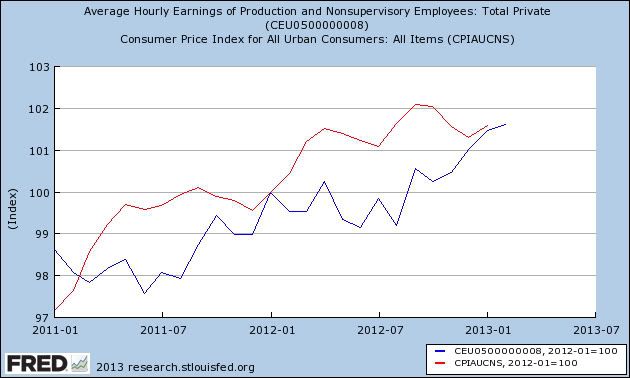
A final graph, setting both seasonally unadjusted average hourly earnings (blue) and seasonally unadjusted consumer inflation (red) to 100 as of January 2012, shows that this is primarily about the Oil choke collar loosening slightly:


Notice that inflation has spiked vs wages each spring as the price of gas goes up, and notice the extra spike coinciding with the price of gas going up to $4 a gallon last Labor Day. Consumer prices in February are expected to rise sharply with the price of gas last month, but right now gas prices are actually negative YoY.

As I said above, this could be a fake-out, especially with unemployment still at 7.7%. But I don't argue with the data, and certainly not when it's a positive surprise!

Morning Market Analysis


Yesterday, Marketwatch ran a story titled, Bond Rally Showing Fresh Signs of Fatigue.  Above are three charts of several bond markets.  On top we see the junk bond ETF, which broke a long-term trend in early February, but which has continued to move higher, except not it's using the previous support as resistance.  The intermediate corporate ETF is in the middle while the long-term corporate ETF is on the bottom.  The intermediate ETF has been trading sideways for about five months, while the long-term bond ETF has been moving in a slightly downward sloping channel for five months.  Both have long-term declining MACDs and both are at important support levels.

While none of these is showing clear signs of a sell-off, the sideways movement indicates there may be some fatigue setting in.


Of the major international ETFs I watch,  the Indian ETF was the best performer last week.  On the year-long daily chart (top chart) notice that the ETF broke trend in February and sold-off to the 200 day EMA.  A six month chart (middle chart) shows that prices rebounded sharply, rallying over 7%, moving from the 56 level to the 60 level.   On the P&F chart (bottom chart) notice that prices overall are consolidating with resistance at the 63 level.


Monday, March 11, 2013

Fitch Downgrades Italian Debt

First, an important caveat: I don't like or really trust the ratings agencies.  S&P was one of the primary enablers of the credit crisis, essentially selling their reputation for favorable bond ratings.  And the other ratings agencies aren't much better.  More importantly, these agencies allow portfolio managers at not inconsequential institutions to become lazy in their fiduciary function.

I'm including the following points because they are the type of points that would lead any investor to sell a particular sovereign debt security.  They also point to the fact that the Italian situation is the latest speed bump for the EU:

- The inconclusive results of the Italian parliamentary elections on 24-25 February make it unlikely that a stable new government can be formed in the next few weeks. The increased political uncertainty and non-conducive backdrop for further structural reform measures constitute a further adverse shock to the real economy amidst the deep recession.

- Q412 data confirms that the ongoing recession in Italy is one of the deepest in Europe. The unfavourable starting position and some recent developments, like the unexpected fall in employment and persistently weak sentiment indicators, increase the risk of a more protracted and deeper recession than previously expected. Fitch expects a GDP contraction of 1.8% in 2013, due largely to the carry-over from the 2.4% contraction in 2012.
 

- Due to the deeper recession and its adverse impact on headline budget deficit, the gross general government debt (GGGD) will peak in 2013 at close to 130% of GDP compared with Fitch's estimate of 125% in mid-2012, even assuming an unchanged underlying fiscal stance.
 

- A weak government could be slower and less able to respond to domestic or external economic shocks.

Comments on the Beige Book

Last week, the Fed released the Beige Book.  This is one of my favorite economic releases, as it gives us near real-time data on the condition of the US economy.  Let's look at some of the data points.

Consumer spending expanded in most Districts, but several Districts reported mixed or lower activity among non-auto retailers. Sales strengthened in the Philadelphia and Richmond Districts, and retail sales were higher than a year ago in the Boston, St. Louis, and Minneapolis Districts. San Francisco reported modest growth in sales, Dallas noted flat to slightly higher sales activity, and New York said retail sales were strong in January but slowed in February primarily due to weather. The Chicago District said consumer spending increased at a slower rate, while Cleveland and Atlanta noted mixed sales activity. Kansas City said retail sales decreased since the previous survey period and were expected to remain flat in the months ahead. Many District contacts commented on the expired payroll tax holiday and the Affordable Care Act as having restrained sales growth. Many Districts noted rising gasoline prices and fiscal policy as having a negative effect on consumer sales, and contacts in the Boston, New York, and Minneapolis Districts said severe weather depressed sales somewhat. Contacts in several Districts reported a shift in sales activity from local malls to the Internet and indicated deep discounting among retailers was becoming increasingly common. San Francisco noted somewhat soft sales for traditional retail grocers, whose competition has increased from discount and online retailers.  

Most Districts reporting on auto sales noted solid or strong increases in sales, with the exception of mixed activity in the St. Louis District and a seasonal slowdown in the Dallas District.

A few observations:
  • It's interesting that autos are still selling, and that non-auto retailers are taking the hit from the expiration of the payroll tax holiday.  As the average age of the US car fleet has increased, replacing cars has become an increasing priority.
  • There are several mentions of weather related activity impacting sales.  Remember that this winter has seen several heavy storms hit the northeast, which would impact consumer behavior.  This could also mean that we might see a bump in this activity in the coming months as the storms push certain purchases forward.
  • There are several macro-level events that are hitting sales: the expiration of the payroll tax holiday and fiscal uncertainty.  There is also talk of the effect of the ACA's implementation on sales.  I am less certain about the effects of this, as the impact would mostly be felt by employers rather than consumers.  Rising gas prices are also slowing sales somewhat.
  • The increased use of discounting tells us that retailers are having to pull customers into the stores with various ploys.  This adds further detail to the story of weakening consumer spending.
Nonfinancial services activity continued to grow at a modest pace since the previous Beige Book. St. Louis and San Francisco reported strong demand for technology, logistics, marketing and legal services. Logistics services were also an area of growth in the Philadelphia District, but growth was modest due to firms' concerns about possible federal spending cuts. High-tech services increased in the Kansas City District, but growth was lackluster in the Boston District due in part to weak demand from Europe and Japan. Staffing services firms in the Boston and New York Districts saw improved conditions, but activity was mixed in the Dallas District. Boston, New York, Philadelphia, and Kansas City services contacts continued to be optimistic about growth in the coming months and in the second half of 2013. 

Manufacturing conditions improved in nearly all Districts, but the increases were generally modest. Boston, New York, Cleveland, Richmond, Atlanta, Chicago, St. Louis, Minneapolis and San Francisco reported some increases in factory activity, but the majority noted that the pace of recovery was slow. Conditions were mixed in the Philadelphia and Dallas Districts, and manufacturing activity in the Kansas City District weakened. Contacts in the Cleveland, Richmond, Chicago, and Kansas City Districts cited concerns over government regulation and fiscal uncertainty as a reason for slow growth. 

Some observations:
  • Both service sector and manufacturing growth are classified as "modest."  This characterization is below the latest ISM service reading of 56 and probably a bit lower that the latest ISM manufacturing reading of 54.2.   However, if you think about economic data as existing in a range, than the anecdotal reports and ISM tell us that both sectors are expanding -- they are just doing so moderately.
  • Headwinds are reported from
    • the Japanese slowdown
    • The European slowdown and 
    • Cuts to federal spending.  
    • I'm less certain about the effects of "uncertainty" as the future is always uncertain.
  • Staffing reports were mixed, with two highlighting increased demand but a three more highlighting weak demand.
Residential real estate activity continued to strengthen in most Districts, although the pace of growth varied. Contacts in the Boston, St. Louis, Minneapolis, Kansas City, Dallas, and San Francisco Districts noted strong growth in home sales, while New York and Chicago reported slight improvements. A realtor in the Richmond District indicated that low interest rates continued to motivate home buyers, and potential buyers in the Philadelphia District expressed greater confidence, including entry-level purchasers who had been increasingly opting to rent since mid-summer. Contacts in the Cleveland and Atlanta Districts said sales were higher than a year ago. Home construction increased in most Districts, with the exception of the Kansas City District where it was reported as unchanged. Several Districts noted ongoing strength in multifamily construction, although contacts in the Atlanta and Cleveland Districts mentioned continued financing difficulties for builders. Home prices edged higher in the majority of Districts, with lower inventories generally cited as the primary cause. Richmond and Atlanta Realtors observed multiple offers on many homes. Philadelphia real estate contacts continued to report low-end home prices as firm or rising slightly, while high-end home prices were still falling. Inventories declined in nearly all Districts, with Realtors in several Districts concerned about the impact on future sales volume. 

Some observations:
  • Anyone doubting the housing story isn't paying attention.  
    • Low interest rates are driving buyers into the market.  
    • Prices are rising indicating higher demand than supply.  
    • Low inventory in the new home market is leading to an increasing in building.  
  • If there is a part of the economy that has the potential to have the biggest positive impact this year, this is it.
Labor market conditions generally improved, although several Districts reported restrained hiring. Many Districts reported a rise in temporary employees, while staffing contacts in the Boston District noted an increase in the placement of permanent and temporary-to- permanent workers. Auto dealers in the Cleveland and Kansas City Districts mentioned plans to hire more workers, and Dallas noted robust hiring activity for experienced corporate, energy, and intellectual property lawyers. Positions in the manufacturing industry increased in the New York, Richmond, and Chicago Districts, although several Chicago manufacturers expressed plans to either invest in more productive capital or adjust the hours of existing employees prior to hiring new workers. St. Louis noted weakness in healthcare services and information technology positions, and Cleveland reported reduced hiring plans from commercial builders and coal operators. Employers in several Districts cited the unknown effects of the Affordable Care Act as reasons for planned layoffs and reluctance to hire more staff. Wage pressures were minimal in most Districts, but contacts reported some upward pressure for several skilled positions as a result of higher demand. Some Districts indicated a shortage of skilled workers such as engineers, truck drivers, software developers, and technical jobs, and Atlanta noted a lack of compliance specialists due to heavier regulations in the healthcare industry.  

Some observations:
  • This is the one area of data where I can see the ACA having an effect.  The regulation writing process was stalled until the Supreme Court decision on the act.  Now there is a huge game of catch-up.  The rules are going to be complicated.  Plus -- as this report also notes -- there is a lack of compliance specialists in the ACA and its implementation, so finding someone to guide you through the process is difficult.
  • This is the first report that I can remember where there was talk of any upward wage pressure.  Given that overall unemployment rate is still high, I doubt that this will be a broad-based occurrence.  However, the latest employment data did report a decent sized month to month increase in wages.
  • The rise in temporary workers is a very good sign, as this is a leading indicator of employment in general.
General conclusions:
  • I saw one news story (I can't remember where) that said this particular report used the word moderate or moderately over 40 times.  The point made is clear: the economy is growing although at a slow pace.  This is the same pace we've seen over the last year or so.
  • Both the manufacturing and service sector are growing.   Both this report and the latest ISM/Markit surveys indicates the growth rate is high enough above the 50 level to indicate growth could shift into an above trend rate with the right impetus.
  • Auto sales are still going strong.  This is very important because it indicates that consumers are willing to take on long term debt. This would not be occurring if there was more concern about the future than hope.
  • Housing is still the best underlying story of the economy right now, and presents the best possibility of pulling the US into a higher rate of growth.
  • The comments regarding employment are consistent with the most recent prints of the BLS data: monthly growth a bit above population growth.  There is also some better news on the wages front, as we're starting to see some upward pressure on wages.
  • As we've noted before, there are several important headwinds:
    • The slowdown in Europe is depressing export orders.
    • The fiscal situation in Washington is slowing federal purchases and orders.
    • The ACA -- while cited for non-employment bases slowing -- is probably only have a real effect on employment.
    • The payroll tax hike is hitting non-auto retail sales.

Morning Market Analysis

Short Summary: The market continues to rally.  Stocks continue to be the best performers among asset classes over multiple time frames.  ETF internals are again more bullish with the financial and consumer discretionary sectors contributing to weekly gains.  Just as importantly, the bond market is selling off, with the longer ETFs trading just below important technical levels.


The longer term 60 minute chart (top chart) shows that with the exception of the late February sell-off, stocks continue to move higher.  Most impressively, the trend line that has supported the rally since the beginning of the year continues to provide support.  On the daily chart (bottom chart), prices have gapped higher, moving through the resistance area just above 153.  The EMA picture continues to be bullish with all the EMAs rising.  The MACD has given a new buy signal.  And while the CMF is weak, it is still positive.


Just as important as the stock market rally is the sell-off in the treasury market.  The 7-10 year area (top chart) has dropped to just above its six month low.  The 10-20 year area (middle chart) is just below support and the long end of the market (bottom chart) has moved just below long term support.  A move lower by either of the long-term ETFs would signal an important change in market direction.