Saturday, November 24, 2012
Weekly Indicators: Thanksgiving recovery from Sandy edition
- by New Deal democrat
The limited October data released this past week was mainly housing and it was positive, including existing home sales and housing starts. Permits declined slightly from their 4 year high the month before. Consumter sentiment also declined slightly from its multi-year high. The Leading Economic Indicators rose 0.2, continuing the generally slow advance this year.
The impact of Hurricane Sandy on most of the high frequency weekly indicators is abating, although there is still an effect on some of them such as initial jobless claims.
Same Store Sales and Gallup consumer spending returned to weakly positive across the board:
The ICSC reported that same store sales for the week ending Novmeber 16 fell -0,3%w/w and were up +2.5% YoY. Johnson Redbook reported a typically weak 1,8% YoY gain. Johnson Redbook has consistently been lower than the other series for consumer spending. The 14 day average of Gallup daily consumer spending as of November 21 was $69, compared with $68 last year for this period. This is Gallup's first positive YoY week since Sandy.
Bond yields were mixed and credit spreads reamined close to their recent lows:
Weekly BAA commercial bond yields increased +0.01% this week to 4.47%. Yields on 10 year treasury bonds fell -0.09%to 1.59% The credit spread between the two increased by 0.10% to 2.88. Spreads have increased in the last few weeks, but are still closer to their 52 week low.
Housing reports were again generally positive, reflecting the continued rebound in this sector:
The Mortgage Bankers' Association reported that the seasonally adjusted Purchase Index declined -2.2% from the prior week, and is also down -6% YoY (last year at this time they were at a 2 year high). These remain in the upper part of their 2+ year range. The Refinance Index also declined -3% for the week, but this is still near its recent multi-year highs.
The Federal Reserve Bank's weekly H8 report of real estate loans this week fell 15 w/w to 3539. The YoY comparison decreased to +1.2%, and is 1.9% above its bottom.
YoY weekly median asking house prices from 54 metropolitan areas at Housing Tracker increased +2.2% from a year ago. YoY asking prices have been positive for over 11 months.
Money supply remains generally positive:
M1 declined -0.9% for the week, but increased +1.2% month over month. Its YoY growth rate declined slightly to +13.3%. Real M1 also declined to +11.1% YoY. M2 was up +0.4% for the week, and was up 0.8% month over month. Its YoY growth rate increased slightly to 7.5%, so Real M2 remained steady at 5.3%. The growth rate for real money supply remains quite positive.
Employment related indicators were mixed, mainly due to Sandy:
The Department of Labor reported that Initial jobless claims fell from 438,000 to 410,000. The four week average rose by 13,000 to 396,250. If this follows a similar pattern to that of Hurricane Katrina, by next week we should be back near a normal reading in the weekly number.
The American Staffing Association Index was again level at 95, the same level at which has been for over 2 months. The sieways trend in this index remains similar to last year.
The Daily Treasury Statement showed that for the first 14 days of November, $104.9 B was collected vs. $99.1 B a year ago, a $5.8 B increase. For the last 20 days ending on Wednesday, $142.4 B was collected vs. $136.0 B for the comparable period in 2011, an increase of $6.4 B or +4.7%. Tax collections continue to run very well.
Rail traffic remained negative YoY, but still due to coal, while the diffusion index rose again:
The American Association of Railroads reported that total rail traffic was down -7,000 carloads YoY, or -1.3%. This is another improvement over the last few weeks. Non-intermodal rail carloads were again off a large -4.3% YoY or -12,900, once again entirely due to coal hauling. Excluding coal. Negative comparisons increased again to 11. Intermodal traffic was up 5900 or +2.4% YoY.
Finally, the price of oil rose slightly again while gasoline fell, but gasoline usage was positive:
Gasoline prices fell another $.02 last week to $3.43. This is still higher than last year at this time. Oil prices per barrel increased from $87 to $88.28. Surpirsingly, Gasoline usage was actually UP for one week at 8908 M gallons vs. 8898 M a year ago, or +0.1%. The 4 week average at 8739 M vs. 8602 M one year ago, was also up again, +2.2% YoY.
Turning now to the high frequency indicators for the global economy:
The TED spread declined towards its 52 week low, down to 0.22. The one month LIBOR rose slightly off its 52 week low of 0.2075, up to 0.2085. Both are well below their 2010 peaks.
The Baltic Dry Index rose from 1036 to 1090. The longer term declining trend in shipping rates for the last 3 years remains. The Harpex Shipping Index fell 3 to a new 52 week low of 364.
Finally, the JoC ECRI industrial commodities index rose from 120.04 to 120.13. It was again slightly positive YoY.
The weekly data is rebounding from Hurricane Sandy's influence. Housing is now a consistent positive. Bonds, money supply, and bank rates also continue positive. Rail loads are positive ex-coal, negative including coal. Gas prices are helpful. Consumer spending has returned to slightly positive. Tax withholding is positive. Only credit spreads were a negative this week. Initial jobless claims are still due to Sandy, but should be more normal next week. Given the positive if muted tone, all things considered we can give thanks.
Have a nice weekend.


Thursday, November 22, 2012
Liveblogging World War 2: FDR's 1942 Thanksgiving Day proclamation
- by New Deal democrat
 *
With a tip of the hat to Prof. Brad DeLong's "Liveblogging World War 2" ...
------
"It is a good thing to give thanks unto the Lord."
Across the uncertain ways of space and time our hearts echo those words, for the days are with us again when, at the gathering of the harvest, we solemnly express our dependence upon Almighty God.
The final months of this year, now almost spent, find our Republic and the nations joined with it waging a battle on many fronts for the preservation of liberty.
In giving thanks for the greatest harvest in the history of our nation, we who plant and reap can well resolve that in the year to come we will do all in our power to pass that milestone; for by our labors in the fields we can share some part of the sacrifice with our brothers and sons who wear the uniform of the United States.
It is fitting that we recall now the reverent words of George Washington, "Almighty God, we make our earnest prayer that Thou wilt keep the United States in Thy holy protection," and that every American in his own way lift his voice to Heaven.
I recommend that all of us bear in mind this great Psalm:
The Lord is my shepherd; I shall not want.
He maketh me to lie down in green pastures; he leadeth me beside the still waters. He restoreth my soul; he leadeth me I the paths of righteousness for his name’s sake
. Yea, though I walk through the valley of the shadow of death, I will fear no evil; for thou art with me; thy rod and thy staff they comfort me.
Thou preparest a table before me in the presence of mine enemies; thou annointest my head with oil; my cup runneth over.
Surely goodness and mercy shall follow me all the days of my life; and I will dwell in the house of the Lord for ever.
Inspired with faith and courage by these words, let us turn again to the work that confronts us in this time of national emergency : in the armed services and the merchant marine; in factories and offices; on farms and in the mines; on highways, railways and airways; in other places of public service to the Nation; and in our homes.
NOW, THEREFORE, I, FRANKLIN D. ROOSEVELT, President of the United States of America, do hereby invite the attention of the people to the joint resolution of Congress approved December 26, 1941, which designates the fourth Thursday in November of each year as thanksgiving Day’ and I request that both Thanksgiving Day, November 26, 1942, and New Year’s Day, January 1, 1943, be observed in prayer, publicly and privately.
IN WITNESS WHEREOF, I have hereunto set my hand and caused the seal of the United States of America to be affixed.
DONE at the City of Washington this eleventh day of November, in the year of our Lord nineteen hundred and forty-two, and of the Independence of the United States of America the one hundred and sixty-seventh.
FRANKLIN D. ROOSEVELT
--------------
* "Freedom from Want", Norman Rockwell, 1943
Wednesday, November 21, 2012
Happy Thanksgiving
My Dad gets in later today, so I'm booked with family events through the weekend. NDD is off as well but will have something up tomorrow. We'll both be back on Monday.
Have a good holiday.
Until then, enjoy some muppets:
Have a good holiday.
Until then, enjoy some muppets:
The Economic Impact of Global Warming
The World Bank has issued a devastating report on the impacts of global warming. The executive summary alone is enough to illustrate the depth of the problem.
Here is a brief summation from the executive summary:
The 4°C scenarios are devastating: the inundation of coastal cities; increasing risks for food production potentially leading to higher malnutrition rates; many dry regions becoming dryer, wet regions wetter; unprecedented heat waves in many regions, especially in the tropics; substantially exacerbated water scarcity in many regions; increased frequency of high-intensity tropical cyclones; and irreversible loss of biodiversity, including coral reef systems.
And most importantly, a 4°C world is so different from the current one that it comes with high uncertainty and new risks that threaten our ability to anticipate and plan for future adaptation needs.
The lack of action on climate change not only risks putting prosperity out of reach of millions of people in the developing world, it threatens to roll back decades of sustainable development.
It is clear that we already know a great deal about the threat before us. The science is unequivocal that humans are the cause of global warming, and major changes are already being observed: global mean warming is 0.8°C above pre industrial levels; oceans have warmed by 0.09°C since the 1950s and are acidifying; sea levels rose by about 20 cm since pre-industrial times and are now rising at 3.2 cm per decade; an exceptional number of extreme heat waves occurred in the last decade; major food crop growing areas are increasingly affected by drought.
Despite the global community’s best intentions to keep global warming below a 2°C increase above pre-industrial climate, higher levels of warming are increasingly likely. Scientists agree that countries’ current United Nations Framework Convention on Climate Change emission pledges and commitments would most likely result in 3.5 to 4°C warming. And the longer those pledges remain unmet, the more likely a 4°C world becomes.
Data and evidence drive the work of the World Bank Group. Science reports, including those produced by the Intergovernmental Panel on Climate Change, informed our decision to ramp up work on these issues, leading to, a World Development Report on climate change designed to improve our understanding of the implications of a warming planet; a Strategic Framework on Development and Climate Change, and a report on Inclusive Green Growth. The World Bank is a leading advocate for ambitious action on climate change, not only because it is a moral imperative, but because it makes good economic sense.
Morning Market Analysis
Let's start by looking at the BRICs' long term charts. I looked at the Brazilian long-term chart yesterday.

The Chinese market broke out of its consolidation pattern about a month an a half ago, but has since fallen back to trading within the range. Prices are now right at the 200 week EMA and the remaining EMAs are trading in a tight pattern around the 200 week EMA.


Both the Indian market (top chart) and Russian marker (bottom chart) are trading in a sideways consolidation pattern at the bottom of multi-year charts. Both are also below their respective 200 week EMAs.
The charts above (and yesterday's Brazilian chart) show that the previous primary drivers of the world economy are not in a position to do so now. China is changing the composition of its economy by making it less export dependent. This is leading in part to the slow down in Brazil. Russian is heavily dependent on raw material exports and India has a big problem with its government structure.

After spiking in the spring, the grains complex has been slowly moving lower. Prices are now trading at the 50 week EMA at price levels established in early 2011.

The daily chart shows this in more detail. Prices spiked in the early summer as the effect of the US drought started to become apparent. Prices have been drifting lower and are now trading at the 200 day EMA. Also note the negative MACD and CMF reading.
Tuesday, November 20, 2012
Bonddad Linkfest
- Conservatives assert themselves in GOP fight (WaPo)
- Fixing loopholes alone won't cure fiscal cliff (Poitico)
- Markets shrug off French downgrade for now (Marketwatch)
- Homebuilder sentiment hits 6-year peak (Marketwatch)
- Foreclosures drop 19% YOY (Marketwatch)
- BOJ policy statement (BOJ)
- The end of the equity cult (FT)
- US pension plans unrealistic targets (FT)
Something Else to Think About
From Barry over at the Big Picture -- What Else is Driving the Markets?
1.) We're entering the last month of the year when trading desks are half full and people are taking more time off.
2.) The Middle East is a powder keg. Even if we get a resolution to the current Israeli/Palestinian conflict, there is Iran.
3.) Japan is in the middle of another recession.
4.) China's economy is re-balancing, leading to slower growth.
5.) Australia's economy, which is heavily resource dependent, will start to experience a slowdown in the next 12-18 months as projected capital projects come to fruition and no other source of growth is in the wings.
6.) The US is still stuck in the 0%-2% growth range.
7.) Long-term unemployment is still a big problem
8.) State and local governments are still implementing their own version of austerity on the US economy.
9.) The South Korean Economy is slowing down
10.) Brazil is experiencing slow growth.
1) Earnings are the weakest in 3 years
2) Portfolios have been poorly positioned for higher Capital Gains and Dividend taxes
3) Europe crisis unresolved, and getting worse
4) The 17% rally in first 3 quarters had markets ahead of themselves
5) The decreasing impact of Federal Reserve QE.Let me add a few more points.
1.) We're entering the last month of the year when trading desks are half full and people are taking more time off.
2.) The Middle East is a powder keg. Even if we get a resolution to the current Israeli/Palestinian conflict, there is Iran.
3.) Japan is in the middle of another recession.
4.) China's economy is re-balancing, leading to slower growth.
5.) Australia's economy, which is heavily resource dependent, will start to experience a slowdown in the next 12-18 months as projected capital projects come to fruition and no other source of growth is in the wings.
6.) The US is still stuck in the 0%-2% growth range.
7.) Long-term unemployment is still a big problem
8.) State and local governments are still implementing their own version of austerity on the US economy.
9.) The South Korean Economy is slowing down
10.) Brazil is experiencing slow growth.
Australian and Canadian Dollars Are Now Officially Reserve Currencies
From Marketwatch:
The Australian and Canadian dollars, the world’s leading commodity-rich currencies, are being formally classified as official reserve assets by the International Monetary Fund, marking the onset of a multi-currency reserve system and a new era in world money.
The Australian and Canadian dollars, the world’s leading commodity-rich currencies, are being formally classified as official reserve assets by the International Monetary Fund, marking the onset of a multi-currency reserve system and a new era in world money.
In a seemingly innocuous yet highly portentous move, the IMF is asking
member countries from next year to include the Australian
AUDUSD
+0.6277%
and Canadian dollars
USDCAD
-0.4432%
in statistics supplied by reserve-holding nations on the make-up of
their central banks’ foreign exchange reserves. The technical-sounding
measure, reflecting growing diversification of the world’s $10.5
trillion of reserves, is likely over time to exert wide-ranging impact
on world bond and equity markets.
Expanding by two the list of officially recognized reserve assets from
the present five — the dollar, euro, sterling, yen and Swiss franc —
signals a new phase in the development of reserve money. For most of the
past 150 years, the world has had just two reserve currencies, with
sterling in the lead until the First World War, and the dollar taking
over as the prime asset during the past 100 years.
Morning Market Analysis


Both the Italian (top chart) and French (bottom chart) market moved through month long downside resistance yesterday. The Italian market did so on very strong volume. In contrast, the French market's volume is a bit uninspiring. Both are also at to near the 200 day EMA, making the move that much more important. The key to yesterday's moves is today's follow-through.

Oil had a strong move through resistance yesterday. Over the last week and a half, prices have moved though the 10, 20 and 50 day EMA, while also getting a buy signal from the MACD. The next logical price target on this chart is the 200 day EMA level.

The weekly chart of the Brazilian market shows an incredibly weak technical picture. Prices have broken through a nine month trend line after approaching a Fibonacci fan. In addition, the MACD and RSI are showing weakness.

The industrial metals market continues its bottoming process. After a sharp fall in October, prices bottomed at the 18 price level for about a month. Now prices are moving higher and yesterday, they moved through key resistance.
Monday, November 19, 2012
Bonddad Linkfest
- The Republicans future really isn't that bad (WaPo)
- Republicans at a crossroads (Politico)
- Harden US infrastructure before it's too late (Politico)
- Is Rush Limbaugh's America Gone (NYT)
- Yen bears see vindication (BB)
- Bespoke's sector snapshot (Bespoke)
- S&P is the cheapest since Reagan (BB)
- Two types of currency intervention (The Money Illusion)
- Tax reform won't do much for growth (Wonkblog)
The US' Infrastructure Is Still In Terrible Shape
Every so often, I like to return to this topic: the rotten state of the US' infrastructure. I realize it's old news and no one in Washington really cares, but the US does need serious work in this area.
Europeans visiting the Northeastern United States – and many parts of the East Coast — can show their children what Europe’s infrastructure looked like during the 1960s.
.....
Malte Lehming, opinion-page editor of the Berlin newspaper Tagesspiegel, noted in his essay “Welcome to America. Take a Number” in The New York Times:
Last fall, for example, after a brief storm dumped wet snow on trees, many parts of New Jersey, Princeton included, were without power for about a week. Parts of Connecticut were without power for more than two weeks.
Europeans visiting the Northeastern United States – and many parts of the East Coast — can show their children what Europe’s infrastructure looked like during the 1960s.
.....
Malte Lehming, opinion-page editor of the Berlin newspaper Tagesspiegel, noted in his essay “Welcome to America. Take a Number” in The New York Times:
I spent half a day hunting for a store with flashlights in stock, because a storm had knocked out our power. In five decades in Germany I have never experienced a single power failure, because the power lines are usually underground and well maintained.Imagine that – life without power failures! In much of the Northeastern United States – and perhaps in many other parts of the country as well – lengthy power disruptions are part of the American way of life. In Princeton, they occur somewhere in the township after almost every thunderstorm or snowstorm, as branches snap from trees and take down vulnerable power lines.
Last fall, for example, after a brief storm dumped wet snow on trees, many parts of New Jersey, Princeton included, were without power for about a week. Parts of Connecticut were without power for more than two weeks.
The EU's Recession In Ugly Pictures
Consider the following charts of economic activity from the Euro area:

Courtesy of Dr. Ed, we see that overall EU industrial production hasn't recovered to its pre-recession levels with the exception of Germany. Most troubling is France, as it is the second largest economy in the Union and is in danger of slipping further into negative territory.


And consider these two charts from the latest Markit Manufacturing survey. The top chart shows that overall manufacturing in the EU area has been contracting for over a year. The bottom chart shows that this problem is widespread, with most countries save Ireland below a reading of 50, indicating expansion.
 Overall GDP growth has been weak for six consecutive quarters. We see two straight quarters of slight contraction (the textbook definition of recession). In addition, save for the zero print three quarters ago, the region would have seen six straight months of contraction.
 Year over year retail sales have been negative for the last two years.

Above is a chart of retail sales for both the EU core and overall EU 27. Note that neither total has rebounded to pre-recession levels. The only element keeping these figures from collapsing is the steady performance of the EU 27, which are simply moving sideways.


The top chart shows that overall IP has been declining since 3Q22. The lower chart shows the YOY rate of decline in both the core and periphery group has been sharp for the last six months.

And the unemployment rate continues to inch higher.
The above charts paint a very disturbing picture: the EU is in a recession and is currently showing no clear path out.

Courtesy of Dr. Ed, we see that overall EU industrial production hasn't recovered to its pre-recession levels with the exception of Germany. Most troubling is France, as it is the second largest economy in the Union and is in danger of slipping further into negative territory.


And consider these two charts from the latest Markit Manufacturing survey. The top chart shows that overall manufacturing in the EU area has been contracting for over a year. The bottom chart shows that this problem is widespread, with most countries save Ireland below a reading of 50, indicating expansion.


Above is a chart of retail sales for both the EU core and overall EU 27. Note that neither total has rebounded to pre-recession levels. The only element keeping these figures from collapsing is the steady performance of the EU 27, which are simply moving sideways.


The top chart shows that overall IP has been declining since 3Q22. The lower chart shows the YOY rate of decline in both the core and periphery group has been sharp for the last six months.

And the unemployment rate continues to inch higher.
The above charts paint a very disturbing picture: the EU is in a recession and is currently showing no clear path out.
Morning Market Analysis
The overall tenor of the markets has become decidedly defensive. The dollar and bonds are outperforming commodities and equities over multiple time frames (weekly, monthly and three month) as money looks for safe plays. The technology sector continues to drop as well. Staples, health care and utilities dropped last week, but at a smaller rate than other sectors, further reinforcing the safety trade dimension to current trading.


The 30 minute SPY chart (top chart) shows two important technical developments last week. First, prices broke support between the 137.5-138 level and fell about 2% to 135. Next, prices consolidated in a sideways move between 135 and 136.5 on Thursday and Friday. The daily chart (bottom chart) shows that prices have broken the 200 day EMA and are now headed for the 38.2% Fib level just above 134. All of the underlying technicals argue for a continued move lower: the MACD is dropping, prices are weakening, money is flowing out of the market and the shorter EMAs are all moving lower.


The entire treasury curve has caught a bid and moved through important technical areas. The 3-7 year sector (top chart) has moved above the upper resistance line of its consolidation pattern. In addition, it's moved above the 127.70 price level. The 7-10 year sector (middle chart) broke its downward sloping resistance line last week and has also moved above key resistance in the 108.5/108.6 area. The 20+ year end of the market (bottom chart) broke key downside resistance a few weeks ago and has also moved above key levels at the 124 level. Currently, 127 offers resistance.
Saturday, November 17, 2012
Weekly Indicators: 1 picture is worth 1000 words edition
- by New Deal democrat
One picture tells you all you really need to know about both the monthly and weekly data released in the past week. Below is a screen capture of a weather radar at about 10 p.m. on October 30, showing the eye of Hurricane Sandy passing directly over the city of Philadelphia:

Because the storm approached from the southeast, the "right" side of the storm, which is the strongest, was actually northeast of the eye as it crossed New Jersey. In other words, the southern half of the NYC metro area along with most of the Jersey Shore took a direct hit. Between the NYC and Philly metro areas, about 30 million people, or 10% of the entire US population, had More Important Things To Do in the last few days of October and the first part of November than produce and consume goods and services. Almost all of the data reflects that reality. Since the effects of Hurricane Sandy are overwhelming almost all the other signal in the economic data, it will be impossible for the next month or so for the actual underlying strength or weakness to show up in the monthly numbers. We'll begin to see what is really going on in the weekly numbers, but probably not until next week.
For the record, the monthly data released this past week was all negative. Retail sales were down, industrical production was down, capacity utilization was down, the Empire and Philly Fed Indexes showed contraction, and producer prices were down. Only consumer prices for October were up, +0.1%.
Almost all of the high frequency weekly indicators this past week were again affected by Hurricane Sandy, so they must be treated with lots of skepticism. The influence of the hurricane should wane beginning next week.
Same Store Sales and Gallup consumer spending varied from very weakly positive to substantially negative:
The ICSC reported that same store sales for the week ending October 26 rose +0,7%w/w and were up +1.8% YoY. Johnson Redbook reported a weak 1,6% YoY gain. Johnson Redbook has consistently been lower than the other series for consumer spending. The 14 day average of Gallup daily consumer spending as of November 8 was $65, compared with $71 last year for this period. This is the second week in a row of a very poor showing in a long time for Gallup. The effects of Sandy will still show up for about one more week.
Bond yields were mixed and credit spreads reamined close to their recent lows:
Weekly BAA commercial bond yields declined -0.03% this week to 4.46%. Yields on 10 year treasury bonds fell -0.06%to 1.68% The credit spread between the two increased by 0.01% to 2.78, just off its 15 month low. This remains an excellent trend, as it demonstrates a lack of fear of corporate default.
Housing reports were all quite positive, reflecting the continued rebound in this sector:
The Mortgage Bankers' Association reported that the seasonally adjusted Purchase Index rose 11% from the prior week, and is also up 22% YoY. These remain in the upper part of their 2+ year range. The Refinance Index also rose 13% for the week, moving back towards recent multi-year highs.
The Federal Reserve Bank's weekly H8 report of real estate loans this week rose by 34 w/w to 3563, the highest number in several years. The YoY comparison increased to +1.8%, and is 2.5% above its bottom.
YoY weekly median asking house prices from 54 metropolitan areas at Housing Tracker increased +1.5% from a year ago. YoY asking prices have been positive for over 11 months, although this is the weekest YoY comparison in many months.
Money supply remains generally positive:
M1 declined -0.9% for the week, but increased +1.6% month over month. Its YoY growth rate declined slightly to +13.4%. Real M1 also declined to +11.2% YoY. M2 was up +0.4% for the week, and was up 0.8% month over month. Its YoY growth rate increased slightly to 7.5%, so Real M2 remained steady at 5.3%. The growth rate for real money supply remains quite positive.
Employment related indicators were pretty awful:
The Department of Labor reported that Initial jobless claims rose from 355,000 last week to 438,000. The four week average rose by 13,250 to 383,250. New Jersey had been unable to report a week ago, and has indicated that initial claims there surged in the wake of Sandy.
The American Staffing Association Index was again level at 95, the same level at which has been for over 2 months. The sieways trend in this index is similar to last year.
The Daily Treasury Statement showed that for the first 10 days of November, $72.0 B was collected vs. $68.8 B a year ago, a $3.2 B increase. For the last 20 days ending on Thursday, $125.1.5 B was collected vs. $127.7 B for the comparable period in 2011, a decline of $2.6 B or -2.0%. This is the first time in many months that the 20 day YoY comparison was negative.
Rail traffic remained negative YoY, but still due to coal, while the diffusion index decreased considerably:
The American Association of Railroads reported that total rail traffic was down -11,600 carloads YoY, or -2.2%. This is actually an improvement over the last few weeks. Non-intermodal rail carloads were again off a large -5.4% YoY or -16,100, once again entirely due to coal hauling which was off -21,000. Excluding coal, carloads were up 4900. Negative comparisons declined to 8 types of carloads from 11. Intermodal traffic was up 4500 or +1.9% YoY.
Finally, the price of oil rose slightly again while gasoline fell, but gasoline usage was positive:
Gasoline prices fell another $.04 last week to $3.45. This is still higher than last year at this time. Oil prices per barrel increased from $86.07 to $87. Surpirsingly, Gasoline usage was actually UP for one week at 8908 M gallons vs. 8625 M a year ago, or +3.3%. The 4 week average at 8638 M vs. 8579 M one year ago, was again up, +0.7% YoY.
Turning now to the high frequency indicators for the global economy:
The TED spread advanced slightly higher off its 52 week low, up to 0.24. The one month LIBOR fell once again to yeat another new 52 week low of 0.2075. Both are well below their 2010 peaks.
The Baltic Dry Index rose from 940 to 1036, well above its recent 52 week low of 662. The longer term declining trend in shipping rates for the last 3 years remains. The Harpex Shipping Index remained at its 52 week low of 367.
Finally, the JoC ECRI industrial commodities index rose from 118.99 to 120.04. It was again slightly positive YoY.
Very little should be read into the data this week and for the past several weeks, as the change in most has been all about Hurricane Sandy. That being said, housing, money supply, bank overnight rates, and corporate yields and credit spreads all remained very positive. Gas prices are for now a positive, and usage has actually increased slightly. Other commodities are neutral. Rail ex-coal is also up.
Employment- and consumption-related data took big hits. Rail including coal remained down.
Jobless claims should continue to be swamped by the affects of Sandy again next week, but other high frequency indicators should return closer to normal. It will lead monthly data, as to which November's data, reported a month from now, will still be affected by the Hurricane. In the meantime, have a nice weekend.
Friday, November 16, 2012


Yen Finally Looking to Move Lower
On Wednesday, I wrote the following about the yen:
The weekly yen chart shows that prices are at important levels. After printing negative GDP, it's standard practice for the underlying currency to weaken. However, the yen is also a key currency that is a primary safety trade and carry trade play. As such, there's a decent bid for it.
The yen has now moved lower. Consider these charts:

On the daily ETF, the 122 price level was providing important technical support. Prices moved through that level yesterday. Also note that prices are now below the 200 day EMA, as are the shorter EMAs. In addition, the EMAs are now bearishly aligned.

The weekly chart has printed a very strong candle on higher volume.
Considering Japan is now facing its fifth recession in the last 15 years, they need correspondingly cheaper currency. It looks like they're finally getting it.
Morning Market Analysis; Europe Barely Hanging On
The charts below of major European equity indexes have a great deal in common, which is why I'm presenting them together with a common introduction. All have had some type of rally over the last six months. In addition all are now either barely hanging on technically or moving lower.

The German ETF rallied from a nit above 18.5 to 23.5 over the August to September time frame. PRices consolidated afterward and are now moving below the technically important level of 22.5. The next logical stop is the 200 day EMA.

The Italian market rallied sharply during the summer, but is now barely hanging on at the 12 price level, which is also right at the 200 day EMA.

The Spanish ETF is right at the 200 day EMA as well, which is also a technically important price level.

The French market has been consolidating between 21 and 22.5. Like the other charts, the 200 day EMA is looming large on this chart.

The British market has already broken trend and is resting on the 200 day EMA. A break here would be a big technical development that would likely start the other averages moving lower.
Thursday, November 15, 2012
Weekly unemployment claims: don't panic, it's Hurricane Sandy
- by New Deal democrat
Initial unemployment claims jumped about 80,000 last week to 439,000. This is almost certainly an outlier due to Hurricane Sandy, which disrupted both the NYC and Philadelphia metro areas with a combined population of about 30 million people, or almost 10% of the entire country's population.
The exact same thing happened after Hurricane Katrina, which struck at the end of August in 2005. Here's the graph of initial claims starting with January 1, 2004:
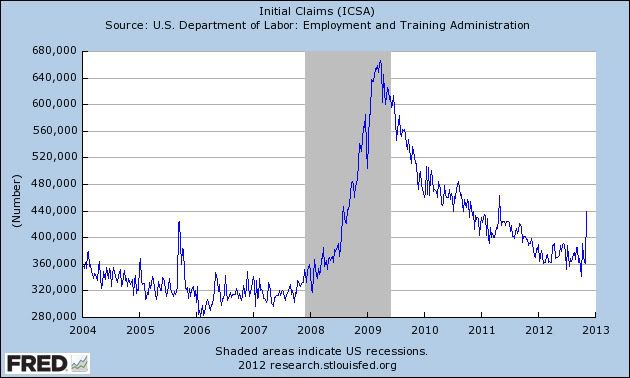
See that spike of about 120,000 late in 2005? Those are the first two full weeks in September, right after Katrina. After that claims returned to their more typical readings.
This spike of 80,000 isn't quite so bad. If after a couple of weeks it hasn't returned below 380,000, then I'd be concerned. This week's increase isn't worth worrying about.
Germany's Weakening Economy
While most of Europe has been hit by the slowdown, Germany for the most part appears to have weathered the storm pretty well. Until the last month, that is. Recent statistics indicate the European stalwart is being bit by a slowdown.

The manufacturing PMI issued by Markit has been in contraction for most of 2020. And while this number rebounded a bit over the year, the recent readings have been lower. New orders are down, and new export orders dropped sharply. Backorder work also decreased, indicating manufacturers may start running out of things to do, leading to layoffs.

And now, the services sector is following the manufacturing sector into contraction territory. While the overall reading has only registered a negative number over the last three months, new orders have been dropping for 7. Like the manufacturing sector, employers are focusing on their backlog of orders, which has fallen in each month since March.
Finally, consider falling industrial production:
The seasonally adjusted 1.8 per cent month-on-month fall in industrial production was worse than expected and followed other data published by the German economy ministry on Tuesday that showed factory orders fell 3.3 per cent in September.
Here are the charts from the German Statistics Bureau:

Overall production has been stable for the last year, but we haven't seen a strong advance. On the good side, there hasn't been a strong decrease, either, which considering the overall EU situation is pretty good.

The overall new orders number is also not encouraging.

The manufacturing PMI issued by Markit has been in contraction for most of 2020. And while this number rebounded a bit over the year, the recent readings have been lower. New orders are down, and new export orders dropped sharply. Backorder work also decreased, indicating manufacturers may start running out of things to do, leading to layoffs.
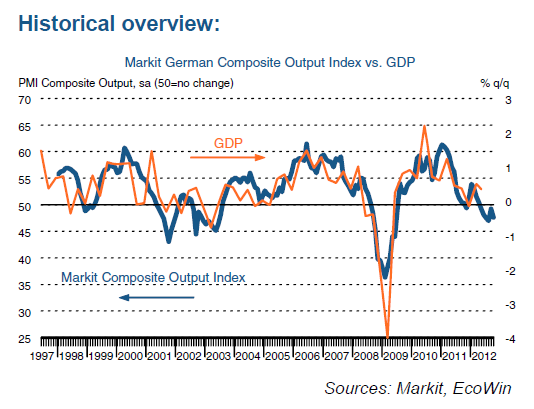
And now, the services sector is following the manufacturing sector into contraction territory. While the overall reading has only registered a negative number over the last three months, new orders have been dropping for 7. Like the manufacturing sector, employers are focusing on their backlog of orders, which has fallen in each month since March.
Finally, consider falling industrial production:
The seasonally adjusted 1.8 per cent month-on-month fall in industrial production was worse than expected and followed other data published by the German economy ministry on Tuesday that showed factory orders fell 3.3 per cent in September.
Here are the charts from the German Statistics Bureau:

Overall production has been stable for the last year, but we haven't seen a strong advance. On the good side, there hasn't been a strong decrease, either, which considering the overall EU situation is pretty good.

The overall new orders number is also not encouraging.
Morning Market Analysis


It's best to view the three major equity markets (Russell, NASDAQ and S&P 500) in their totality to get a wider view of potential market direction. The combination of the three charts shows that a sell-off is clearly underway and shows no hint of slowing. The Russell and QQQs are both through all major fib levels with declining momentum. While the SPYs have one ore Fib level for support, momentum is clearly to the downside. In addition, both the Russell and NASDAQ are now below the 200 day EMA.


The weekly copper chart (top chart) is still in a triangle consolidation pattern, although prices are now approached critical support levels. The 43 price level is critical to this chart; a move lower would obviously be bearish for this individual market, but for the economy as a whole. The broader industrial metals market (lower chart) is in the same technical boat; prices are trading near multi-year lows.

The oil market is still consolidating in a downward sloping pennant pattern.
Subscribe to:
Posts (Atom)