- Iraq oil production increases (NYT)
- A tax cut history lesson (Thoma)
- Five reasons the job engine is seizing up (BB)
- Spain calls for a unified fiscal authority (FT)
- Cross border lending drops sharply (FT)
- Chinese service sector is slowing (Marketwatch)
- Chinese manufacturing slows (Marketwatch)
- Merkel more isolated (BB)
- John Taylor really misunderstands Hayek (Uneasy Money)
- Is Estonia the austerity crown jewel? (Macro Matters)
Monday, June 4, 2012
Bonddad Linkfest


Actually, the Economy Isn't As Bad As The Employment Report Indicates

The above graphic -- which I posted on Friday -- is very concerning as it shows two negative developments. First, we're repeating the exact same pattern this year as last year -- Europe sneezes and we catch a cold. Second, we now have four months of declining jobs data, which includes downward revisions to the previous months. This is the exact pattern you'd expect before a recession. So, let's look at the underlying data to see if that is confirmed, starting with the leading indicators:
The Conference Board Leading Economic Index® (LEI) for the U.S. declined 0.1 percent in April to 95.5 (2004 = 100), following a 0.3 percent increase in March, and a 0.7 percent increase in February.That is a pretty apt description of the economy -- one that is trying to "gain momentum." Here's a graph of the latest data:
Says Ataman Ozyildirim, economist at The Conference Board: “The LEI declined slightly in April. Falling housing permits, rising initial claims for unemployment insurance and subdued consumer expectations offset small gains in the remaining components. The LEI’s six-month growth rate fell slightly, but remains in expansionary territory and well above its growth at the end of 2011. The CEI, a measure of current economic conditions, has also increased for five consecutive months.”
Says Ken Goldstein, economist at The Conference Board: “The indicators reflect an economy that’s still struggling to gain momentum. Growth is slow, but choppy, and consumers, executives and investors are looking for more progress.”

As reported in the release:
Five of the ten indicators that make up The Conference Board LEI for the U.S. increased in April. The positive contributors – beginning with the largest positive contributor – were interest rate spread, average weekly manufacturing hours, ISM® new orders index, Leading Credit Index™ (inverted), and manufacturers’ new orders for consumer goods and materials*. The negative contributors – beginning with the largest negative contributor – were building permits, average weekly initial claims for unemployment insurance (inverted), average consumer expectations for business conditions, and stock prices. The manufacturers’ new orders for nondefense capital goods excl. aircraft* held steady in April.While it's not a great looking picture, it's not one that points to a serious contraction, either.

The overall direction of the LEIs is still positive.

The ISM manufacturing index is still positive. The anecdotal evidence from the latest report -- which was released last Friday -- is actually very positive:
In addition, in the latest report new orders increased to a high reading. While production decreased, it is still positive. And, employment was still positive (which was born out in the latest employment report which showed an increase in manufacturing employment).
- "Business has been trending moderately higher since the beginning of the year. [We] anticipate 5 percent to 7 percent growth for the year." (Chemical Products)
- "Sales were stronger than expected; customers are waiting until the last minute to place orders." (Machinery)
- "We are having the best year in sales volume and profit since mid-2008." (Fabricated Metal Products)
- "Business seems to be holding steady." (Miscellaneous Manufacturing)
- "We had modest growth across most of our businesses, with stable raw materials [prices] and improved schedules and efficiency in our operations." (Textile Mills)
- "Business is lower than forecast for Q2 2012." (Computer & Electronic Products)
- "We are seeing overall steady improvements, month over month and year over year." (Apparel, Leather & Allied Products)
- "Business is steady." (Food, Beverage & Tobacco Products)
- "While not quite as busy as last month, production is steady and year over year still much better." (Transportation Equipment)
- "Business continues to be up in general." (Furniture & Related Products)
Regional reports are mostly just barely positive. New York is positive, Philly's was slightly negative, Richmond was slightly positive, Dallas is slightly positive, Kansas was slightly positive, and the Chicago Fed's index rose in the latest report.

New orders for durable goods are a problem spot, they've essentially leveled off over the last 7 months. This would explain the above referenced manufacturing readings just above 0, showing some growth, but not "barn burning" growth.
Let's turn to services:

The latest ISM services index (a new one will be released on Tuesday) is still positive. The latest report had the following anecdotal information:
The above are less positive than the manufacturing comments, but still good. They show a sector that is growing, albeit slowly.
- "Sales have improved slightly, yet still lag behind pre-recession highs. The hiring freeze has been lifted, but open positions are still being vetted for need, timing of the fill, and so forth." (Public Administration)
- "Business conditions have improved in March and April 2012. We have received more job inquiries and job awards in this period. The increase is about 15 percent." (Professional, Scientific & Technical Services)
- "Current conditions compared to prior year are good. Fuel and food continue to be a challenge." (Arts, Entertainment & Recreation)
- "Business is slowing — and projections for the rest of the year are being lowered." (Professional, Scientific & Technical Services)
- "Business is still ahead of last year, but has leveled off a little." (Wholesale Trade)
- "High price of petroleum/oil driving up costs for all market areas." (Transportation & Warehousing)
Let's turn out attention to the consumer:


Real retail sales are also still in an uptrend and increasing. In fact, they are now at levels seen of the height of the last expansion. In addition, real PCEs are also rising -- and are still in an uptrend. I have noted previously that this is primarily due to durable purchases, but that is also a good sign. People don't buy durables unless they have at least some confidence that the economy will grow or that their fortunes will at least stay the same. The last chart of auto sales shows that this area of the economy is actually doing pretty well, too.
And then, there is this:

Oil is now 83/bbl. While this latest move represents traders placing very negative bets on the economic outlook, it also frees up money for other purchases. As NDD would say, the oil choke collar is loosening.
The underlying picture of the economy is one that is muddling through. With the exception of the employment sector, all indicators are positive, but just barely so. With employment, there are two issues. The first is the EU situation: why hire a bunch of people when one of the largest economic blocks might start to break apart causing a banking and currency panic? The second is lack of demand. While the US consumer is still spending, he's doing so at a restrained pace.
Morning Market Analysis
Let's start by looking at a longer view of three large market: Germany, China and Brazil:

Earlier this year, the German market rallied to just shy of the 61.8% Fib level, but has since fallen. It found initial support at the 200 week EMA level, but has now moved lower, while breaking a trend line. The underlying technicals are weak -- we see a declining MACD, CMF and RSI. The nest logical price target in at the 17-17.25 level.

Interestingly enough, the Chinese market did not make new highs earlier this year, but came just shy of making that mark. Like the German market, Chinese shares have been falling for the better par of this year. Whats most concerning about this chart is the logical price target is about 30 -- about 7.6% below current levels. That would make this years from (from about 40.5) a total of 25% -- bear market territory.

The Brazilian market has fallen the farthest -- from 70 to 50.49, or a drop of almost 28%. In addition, the underlying technicals are all bearish -- dropping momentum and volume and increasing volatility.
Each of these three markets are important in their respective geographic areas. As such, the drops above do not bode well for the future. More importantly, the further downside room on the German and Chinese markets is very concerning.
In addition, consider the following yield curves:

The Australian yield curve is slightly inverted form the 3m to 2 year area. The highest yield we see is 3.2%.

The German yield curve is very low -- the 20-30 year curve is slightly inverted, with the 30 year at 1.70%.

The Japanese yield curve is also very low, with the 30 year showing a rate of just below 1.8%.

The UK yield curve is slightly inverted at the short end of he curve, with a 30 year yield of 2.86%.
Put another way -- there's a tremendous amount of nervousness on the part of traders right now. Money is flowing out of the stock markets and into bonds, with the safest bond markets (Germany and Japan) at incredibly expensive levels.

Earlier this year, the German market rallied to just shy of the 61.8% Fib level, but has since fallen. It found initial support at the 200 week EMA level, but has now moved lower, while breaking a trend line. The underlying technicals are weak -- we see a declining MACD, CMF and RSI. The nest logical price target in at the 17-17.25 level.

Interestingly enough, the Chinese market did not make new highs earlier this year, but came just shy of making that mark. Like the German market, Chinese shares have been falling for the better par of this year. Whats most concerning about this chart is the logical price target is about 30 -- about 7.6% below current levels. That would make this years from (from about 40.5) a total of 25% -- bear market territory.

The Brazilian market has fallen the farthest -- from 70 to 50.49, or a drop of almost 28%. In addition, the underlying technicals are all bearish -- dropping momentum and volume and increasing volatility.
Each of these three markets are important in their respective geographic areas. As such, the drops above do not bode well for the future. More importantly, the further downside room on the German and Chinese markets is very concerning.
In addition, consider the following yield curves:

The Australian yield curve is slightly inverted form the 3m to 2 year area. The highest yield we see is 3.2%.


The German yield curve is very low -- the 20-30 year curve is slightly inverted, with the 30 year at 1.70%.

The Japanese yield curve is also very low, with the 30 year showing a rate of just below 1.8%.

The UK yield curve is slightly inverted at the short end of he curve, with a 30 year yield of 2.86%.
Put another way -- there's a tremendous amount of nervousness on the part of traders right now. Money is flowing out of the stock markets and into bonds, with the safest bond markets (Germany and Japan) at incredibly expensive levels.
Morning Market Analysis


All the major averages are now in a technical correction. The IWMs (top chart) have dropped 12.6%, the QQQs have dropped 11.8% and the SPYs have dropped 9.5%. All are now below their respective 200 day EMAs with the shorter EMAs in a bearish orientation. RSIs are weak, MACDs are declining and CMFs are negative. About the only positive thing on all of these charts is the declining BB width, indicating that volatility is dropping.


Two of the largest -- and most important -- market sectors share the same characteristics. The financials (which account for about 14% of the SPYs) and the technology sector (which accounts for about 19%) either just below or completely below the 200 day EMA. The financials are susceptible to drops caused by the Greek/EU crisis, while the technology sector is getting hit by risk aversion and profit taking.
Saturday, June 2, 2012
Weekly Indicators: was the awful employment report an outlier or a harbinger? edition
- by New Deal democrat
There was a slew of monthly and other data this past week. In the rear view mirror, Q1 GDP was revised down slightly from 2.2% to 1.9%. On the other hand, Q1 GDI, thought by many to be a more accurate measure, was reported at +2.6%. April personal income and spending both rose, and real income also rose. April construction spending also rose, and in particular private residential spending rose signifantly, adding to the evidence that the housing sector is rebounding. May consumer confidence from the Conference Board declined, as did May auto sales. The ISM manufacturing index turned slightly less positive, although new orders rose strongly. And then, of course, came the May payrolls report, which was about as awful as you could get and still generate a positive number. April was revised down. Manufacturing related parts of the index such as workweek and overtime also declined. The unemployment rate rose slightly. One slight positive was that temporary jobs increased slightly.
Let's start by making a couple of points about this column. First of all, it is designed to be predictive but rather an up-to-the-moment report on the economy by use of high frequency weekly indicators. Secondly, while there is some randomness in each week's data, if there is a turning point in the economy, it should show up in these indicators first before it shows up in monthly indicators. So this week let's see if the high frequency data confirms that the awful employment report indicate a negative turn in the economy, or whether it is not supported by other data.
Housing reports remained generally positive:
The Mortgage Bankers' Association reported that the seasonally adjusted Purchase Index fell -1.8% from the prior week, and was down -3.9% YoY. The Refinance Index declined -1.5%. Despite the declines of the last few weeks, this index continues to be in the upper part of its 2 year generally flat range.
The Federal Reserve Bank's weekly H8 report of real estate loans, which had been negative YoY for 4 years, turned positive two months ago. This week, real estate loans held at commercial banks declined -0.4% w/w, and their YoY comparison declined -0.6% to +1.0%. On a seasonally adjusted basis, these bottomed in September and remain up +1.5%.
YoY weekly median asking house prices from 54 metropolitan areas at Housing Tracker were up + 2.0% from a year ago. YoY asking prices have been positive for the last 6 months, are higher than at any point last year, and we are now at the point where seasonally they are at their maximum. For months I've been saying that either this index had to turn or the Case-Shiller repeat sales index had to turn. With Case-Shiller now up two months in a row on a seasonally adjusted basis, I'm going to stick a fork in it. The Housing Tracker index proved its worth and did exactly what I said it was going to do, which is lead the other indexes. Barring the appearance of the long-delayed foreclosure tsunami (which, per Calculated Risk, may only occur in judicial states and be counterbalanced by the winding down of foreclosures in non-judicial states, which never had any delays), the bottom in prices is here.
Employment related indicators were mixed again:
The Department of Labor reported that Initial jobless claims rose 13,000 to 383,000 last week. The four week average stands at 374,500. This renews the question of whether there is a seasonal adjustment issue or whether something more ominous is going on.
The Daily Treasury Statement for the all of May showed $143.0 Bvs. $140.1B for May 2011. For the last 20 reporting days, $119.9 B was collected vs. $117.0 B a year ago, an increase of $2.9 B, or +2.5%. The year over year comparisons in this series have weakened significantly in the last several months, although generally they continue to be weakly positive.
The American Staffing Association Index rose to 94. It has now surpassed 2007 and is only two points below its all time record from 2006 for this week of the year.
Same Store Sales continue to be solidly positive.
The ICSC reported that same store sales for the week ending May 19 fell -0.5% w/w, but were up +2.9% YoY. Johnson Redbook reported a 3.2% YoY gain. Shoppertrak reported a gain of 1.8% YoY. The 14 day average of Gallup daily consumer spending was very positive again this week at $76 vs. $68 in the equivalent period last year.
Money supply was slightly mixed:
M1 fell -0.7% last week, and also fell -0.1% month over month. Its YoY level increased to +16.5%, so Real M1 is up 14.2%. YoY. M2 rose +0.1% for the week, and was up +0.5% month over month. Its YoY advance rose slightly to +9.6%, so Real M2 increased to +7.3%. Real money supply indicators continue to be strong positives on a YoY basis, although they have had a far more subdued advance since September of last year.
Bond prices rose slightly and credit spreads continued to blow out:
Weekly BAA commercial bond rates reported weekly last Monday rose .11% to 5.09%. Yields on 10 year treasury bonds rose .02% to 1.76%. The credit spread between the two incresed again to 3.33%. The trend remains of strongly falling bond yields, which means that fear of deflation is strong. Spreads are now close to their 52 week maximum.
Rail traffic turned more positive this week.
The American Association of Railroads reported a +2.6% increase in total traffic YoY, or +13,700 cars. Non-intermodal traffic turned positive YoY, and was up by +3700 cars, or +1.3% YoY. Excluding coal, this traffic was up +11,300 cars. Ethanol-related grain shipments remained off, as were chemicals. Intermodal traffic was up 10,00 carloads, or +4.3%.
The energy choke collar continues to disengage:
Gasoline prices fell for the sixth straight week, down another .04 to $3.67. Oil fell again this week to end at $83.23. Oil has only been less expensive for about 1 in the last 12 months. Oil prices are now well below the point where they can be expected to exert a constricting influence on the economy. Since gasoline prices follow with a lag, we can expect gasoline to fall to that point in about a month as well. The 4 week average of Gasoline usage, at 8850 M gallons vs. 9083 M a year ago, was off -2.6%. For the week, 8931 M gallons were used vs. 9431 M a year ago, for a decline of -5.3%. Although this week was off, generally gasoline usage is moving to parity with the reduced levels that began to be established one year ago.
Turning now to high frequency indicators for the global economy:
The TED spread rose 0.1 to 0.40, near the bottom of its recent 3 month range. This index remains slightly below its 2010 peak. The one month LIBOR rose 0.001 to 0.240. It is well below its 12 month peak set 3 months ago, remains below its 2010 peak, and has returned to its typical background reading of the last 3 years. It is interesting that neither of these two measures of fear have budged even slightly with the Europanic of the last month.
The Baltic Dry Index fell for the second week in a row, down from 1034 to 904. It remains 234 points above its February 52 week low of 670. The Harpex Shipping Index rose another 2 points from 457 to 459 in the last week, and is up 84 from its February low of 375.
Finally, the JoC ECRI industrial commodities index continued to slide this week, down from 119.64 to 117.74. This is very close to its 52 week low. This indicator appears to have more value as a measure of the global economy as a whole than the US economy.
Friday, June 1, 2012
Weekend Humor
Well -- this week was terrible. To brighten things up, here is a video of the Muppets doing Bohemian Rhapsody.
I'll be back on Monday. NDD will have the indicators tomorrow. Have a safe weekend.
I'll be back on Monday. NDD will have the indicators tomorrow. Have a safe weekend.
Yes, the Employment Report Is Terrible and is Getting Worse

The chart above is from the latest employment report. Last year in the Spring, it looked as though we were getting escape velocity. Then we were hit by Japan's problems, high oil and EU. This year, we have just the EU, which is more than enough trouble.
Also note the declining nature of the overall employment situation.
UPDATE 4: Economic Numbers of Friday: US Employment Report Blows, personal income decent, manufacturing ok, construction spending good, auto sales fall
As NDD noted, there is a ton of data out today. In addition, over the last week, we've seen some really terrible statistics come out of the BRIC's and other economies. This is a post that will keep track of the data as it comes out.
First, before we get to the US report, consider these data points from the developing world.
India's GDP slows to 5.3%. Yes, this is still far higher than the US'. However, with over a billion people, India has to keep a break neck pace of growth alive simply to keep up with population growth. This number is too low to allow that to happen. Yesterday's linkfest has links to three articles on India from Economonitor that provide a really good comprehensive overview of what is happening there.
US GDP was revised down from 2.2% to 1.9% yesterday. While we're still growing, we certainly aren't making any records.
China's factory output is weakening.
Brazil lowered it's interest rates by 50BP on Wednesday, largely because it's growth is coming in just above 1%.
In short, the BRIC's are slowing down sharply. Here's the essential issue: China has powered its growth by becoming the manufacturing center of the world. This has fueled the growth of material exporting countries such as Brazil and Australia. Now China is looking to move away from that model to one more centered on consumer spending. That will have negative impacts on the previously listed countries.
US employment report BLOWS: +69,000 with an unchanged unemployment rate.
_________________
UPDATE: NDD here with details of the blow-iness:
I see just a few rays of sunshine in the storm:
- (1) temporary services, a leading indicator, grew by a grand total of 1,700 jobs;
- (2) the employment to population ratio rose 0.2% to 63.8%, as 642,000 people entered the workforce, more than reversing last month's decline. As an aside, I wonder if permabears will acknowledge that this is why the unemployment rate rose 0.1% to 8.2% -- yeah, probably not;
- (3) the YoY growth rate in employment rose by 15,000 (pending revisions);
- (4) some of the weakness is seasonally adjusted construction employment, which rose 43,000 during the winter (seasonally adjusted) and has now given it back. This is probably an anomoly due to the non-winter winter.
- (5) manufacturing employment continued to grow, up 12,000
Everything else stunk, and frankly, these look like the kind of numbers I would expect to see a few months before a recession begins (but too late for ECRI to be correct). Here are the details:
March and April were revised down. April now shows only 77,000 jobs added. This is what I would expect to happen heading into a recession.
The manufacturing workweek, a leading indicator, declined 0.3 hours.
Factory overtime declined.
The number of people unemployed for 0 to 5 weeks rose again, by 37,000. This is a more timely leading indicator than initial claims.
The unemployment rate rose 0.1% to 8.2%. The broad U-6 unemployment rate rose from 14.5% to 14.8%.
Aggregate hours worked was unchanged. This is a coincident indicator which may form part of the NBER's recession criteria.
Average hourly income rose only 0.1%, or two cents, to $23.41. This is pathetic.
In summary, the coincident parts of the report stunk, but were still positive. Most of the leading indicators in the report turned negative. This was a bad report.
---------------------
Okay, now that you are thoroughly depressed, let's briefly discuss the personal income and spending report, which was better.
Real disposable personal income rose 0.2% in April. Spending rose 0.3%, and so the savings rate declined 0.1% to 3.4%. It looks like real personal income after transfer payments also rose. This is one of the four coincident indicators used by the NBER in making their recession calls.
The good news is that the YoY decline in real income is abating, and could turn positive in a month or two. That would alleviate at least one worry.
------------
UPDATE 2. NDD again....
The ISM manufacturing index for May decreased slightly to 53.5, which still shows expansion. The new orders component, which has just been added to the LEI, increased to 60.1. This is an excellent number and in line with a strongly expanding economy for the last 30 years. Interestingly, the subindex taken out of the LEI, supplier deliveries and the backlog of orders, actually contracted.
Mixed, but almost all positive in various degrees.
--------
Next, construction spending for April. This increased 0.3% from March, which was revised higher from +0.1% to 0.3%. Overall private construction rose 1.2% month over month, while public construction (thank you Austerians) shrank by -1.4%.
Within private construction, nonresidential (e.g., office, warehouse, stores etc.) contracted slightly, down -0.2% month over month.
But the star of the show was private residential construction, up 2.8% month over month. This is housing, folks. Here we are in 2012, and housing is the most improving sector of the economy. Hoocoodanode!!!
Bonddad here:
A commenter recently noted that there is clearly a negative impact coming from the rest of the world, hitting the US. I completely agree with this sentiment. As I've noted for about the last month in the market analysis section, equity markets around the globe are dropping; safe assets are rallying (US, German and UK bonds, US dollar and Japanese yen), commodities are dropping. This is the exact scenario you would expect in a pre-recession trading environment. While I don't think we're in a recession yet, we are getting dangerously close.
___________
NDD again:
Auto sales came in at 13.8 million annualized. This is the lowest reading this calendar year, and mirrors the stall in auto sales that took place exactly one year ago. One year ago at least part of the reason was a parts shortage due to the earthquake and tsunami in Japan. There's no such excuse this year.
Hopefully with gas prices falling, YoY consumer income will catch up and the profound weakness in some of the numbers we got today will pass. We'll continue to pick through the entrails in the coming week.
First, before we get to the US report, consider these data points from the developing world.
India's GDP slows to 5.3%. Yes, this is still far higher than the US'. However, with over a billion people, India has to keep a break neck pace of growth alive simply to keep up with population growth. This number is too low to allow that to happen. Yesterday's linkfest has links to three articles on India from Economonitor that provide a really good comprehensive overview of what is happening there.
US GDP was revised down from 2.2% to 1.9% yesterday. While we're still growing, we certainly aren't making any records.
China's factory output is weakening.
Brazil lowered it's interest rates by 50BP on Wednesday, largely because it's growth is coming in just above 1%.
In short, the BRIC's are slowing down sharply. Here's the essential issue: China has powered its growth by becoming the manufacturing center of the world. This has fueled the growth of material exporting countries such as Brazil and Australia. Now China is looking to move away from that model to one more centered on consumer spending. That will have negative impacts on the previously listed countries.
US employment report BLOWS: +69,000 with an unchanged unemployment rate.
_________________
UPDATE: NDD here with details of the blow-iness:
I see just a few rays of sunshine in the storm:
- (1) temporary services, a leading indicator, grew by a grand total of 1,700 jobs;
- (2) the employment to population ratio rose 0.2% to 63.8%, as 642,000 people entered the workforce, more than reversing last month's decline. As an aside, I wonder if permabears will acknowledge that this is why the unemployment rate rose 0.1% to 8.2% -- yeah, probably not;
- (3) the YoY growth rate in employment rose by 15,000 (pending revisions);
- (4) some of the weakness is seasonally adjusted construction employment, which rose 43,000 during the winter (seasonally adjusted) and has now given it back. This is probably an anomoly due to the non-winter winter.
- (5) manufacturing employment continued to grow, up 12,000
Everything else stunk, and frankly, these look like the kind of numbers I would expect to see a few months before a recession begins (but too late for ECRI to be correct). Here are the details:
March and April were revised down. April now shows only 77,000 jobs added. This is what I would expect to happen heading into a recession.
The manufacturing workweek, a leading indicator, declined 0.3 hours.
Factory overtime declined.
The number of people unemployed for 0 to 5 weeks rose again, by 37,000. This is a more timely leading indicator than initial claims.
The unemployment rate rose 0.1% to 8.2%. The broad U-6 unemployment rate rose from 14.5% to 14.8%.
Aggregate hours worked was unchanged. This is a coincident indicator which may form part of the NBER's recession criteria.
Average hourly income rose only 0.1%, or two cents, to $23.41. This is pathetic.
In summary, the coincident parts of the report stunk, but were still positive. Most of the leading indicators in the report turned negative. This was a bad report.
---------------------
Okay, now that you are thoroughly depressed, let's briefly discuss the personal income and spending report, which was better.
Real disposable personal income rose 0.2% in April. Spending rose 0.3%, and so the savings rate declined 0.1% to 3.4%. It looks like real personal income after transfer payments also rose. This is one of the four coincident indicators used by the NBER in making their recession calls.
The good news is that the YoY decline in real income is abating, and could turn positive in a month or two. That would alleviate at least one worry.
------------
UPDATE 2. NDD again....
The ISM manufacturing index for May decreased slightly to 53.5, which still shows expansion. The new orders component, which has just been added to the LEI, increased to 60.1. This is an excellent number and in line with a strongly expanding economy for the last 30 years. Interestingly, the subindex taken out of the LEI, supplier deliveries and the backlog of orders, actually contracted.
Mixed, but almost all positive in various degrees.
--------
Next, construction spending for April. This increased 0.3% from March, which was revised higher from +0.1% to 0.3%. Overall private construction rose 1.2% month over month, while public construction (thank you Austerians) shrank by -1.4%.
Within private construction, nonresidential (e.g., office, warehouse, stores etc.) contracted slightly, down -0.2% month over month.
But the star of the show was private residential construction, up 2.8% month over month. This is housing, folks. Here we are in 2012, and housing is the most improving sector of the economy. Hoocoodanode!!!
Bonddad here:
A commenter recently noted that there is clearly a negative impact coming from the rest of the world, hitting the US. I completely agree with this sentiment. As I've noted for about the last month in the market analysis section, equity markets around the globe are dropping; safe assets are rallying (US, German and UK bonds, US dollar and Japanese yen), commodities are dropping. This is the exact scenario you would expect in a pre-recession trading environment. While I don't think we're in a recession yet, we are getting dangerously close.
___________
NDD again:
Auto sales came in at 13.8 million annualized. This is the lowest reading this calendar year, and mirrors the stall in auto sales that took place exactly one year ago. One year ago at least part of the reason was a parts shortage due to the earthquake and tsunami in Japan. There's no such excuse this year.
Hopefully with gas prices falling, YoY consumer income will catch up and the profound weakness in some of the numbers we got today will pass. We'll continue to pick through the entrails in the coming week.
Every economic statistic in the entire effing world will be released today
- by New Deal democrat
After forcing us information geeks to twiddle our thumbs for the last few weeks, the government and private industry have decided that in the course of about 6 hours today, they are going to throw at us every single economic statistic they could get their hands on, including the kitchen sink (that would be construction spending for April). We also get April income and spending, the May ISM manufacturing report, auto sales, and of course the jobs report.
Oh, yeah, and the European markets are taking a dive.
My mantra will be "value added" so I'll update throughout the day to highlight some of the numbers that others are likely to overlook, especially the forward-looking statistics.
Morning Market Analysis; World Wide Weakness Edition

The Australian market is trading near six month lows. The MACD is declining, the CMF is weak and volatility is up. Also note the EMA position -- all the shorter EMAs are moving lower with the shorter below the longer.

The South Korean market is trading at the 38.2% Fib level from the December to April rally. Like the Australian market, the underlying technicals are weak -- the MACD is declining, the RSI is weak, the CMF is negative and volatility is up.

The Canadian market mirrors the Australian market -- prices are near 6 month lows, the underlying technicals are deteriorating and the shorter EMAs are dropping and bearishly aligned.

The German market is right below the 38.2% line of the December to March rally. The underlying technicals are weak (declining MACD, weak, RSI and negative CMF).
The above four equity markets are for some of the stronger economies on around. Yet, the equity markets are dropping, indicating overall weakness -- or at least perceived weakness.

Industrial metals are also near 6-month lows. Momentum is dropping, volume is a net outflow and RSI is weak. However, overall volatility is lower than you'd expect for a declining market.

Oil is now near six months lows, with all of the weak underlying technicals applicable to this situation.
Thursday, May 31, 2012
Ireland Goes to the Polls On Treaty
From the Washington Post
Linked by a common currency but not a common economy, the crisis-battered euro-zone nations are facing a pivotal choice: Either move more closely together or risk their currency union breaking apart. But are European voters — some in nations divided by centuries of rivalries — willing to take that leap toward closer integration?
The fiercely independent Irish are about to offer a window into the answer.
From the emerald hills of Donegal to the shores of Cork, the Irish go to the polls Thursday in a referendum on a regionwide fiscal treaty inked in January that would impose strict limits on budget deficits and debt. European governments that ratify the treaty will effectively surrender a measure of sovereignty over two of their most sacred economic rights — how much they can borrow and how much they can spend — to the bureaucrats in the region’s administrative capital of Brussels.
The referendum, in many ways, is shaping up as a litmus test of the willingness of Europeans to more deeply link their economic fortunes. As the region’s crisis deepened, European Commission President Jose Manuel Barroso underscored the urgency on Wednesday, heightening calls for radical rule changes that would begin to make the 17 member nations of the euro zone act more and more like the 50 U.S. states.
Why Is State College Tuition Spiking? It's A Lack Of Funding
Yesterday I linked to a piece on the Carpe Diem Blog that argued that "college for all" was bad policy. The post noted the increase in tuition and attributed it entirely to an increase in demand. However, it's really a lack of funding that has been shifting the burden of state schools onto the backs of students. Consider these data points:
The state school system used to provide a great, inexpensive way for students without means to obtain an affordable college education. But the lack of investment in these systems over the last 20 years has led to an increase in tuition costs.
• From 1990-1991 to 2010-2011, total state appropriations rose from $65.1 billion to $75.6 billion. But state funding actually declined in relative terms. [From Bonddad: in inflation adjusted terms, this is a decline]
• If states had provided the same level of per capita support as in 1990-1991, they would have invested $80.7 billion in 2010-2011.
• If states had provided the same level of funding per public, full-time equivalent student as in 1990-1991, total appropriations in 2009-2010 would have equaled approximately $102 billion, an amount 35.3 percent higher.
• The proportion of their revenues that public colleges and universities received from state appropriations dropped from 38.3 percent in 1991-1992 to 24.4 percent in 2008-2009. Rising tuition, fees, and room and board represent a shift in support from the state as a whole to individual students and their families.
In addition, the financial aid system has failed to keep pace with escalating costs, forcing students and their families to rely on financing strategies that reduce their odds of completing school.
• States reoriented their financial aid programs away from need-based assistance to merit-based aid, which favors wealthier students. Students not only pay more than they used to but also borrow more extensively.
The state school system used to provide a great, inexpensive way for students without means to obtain an affordable college education. But the lack of investment in these systems over the last 20 years has led to an increase in tuition costs.
Morning Market Analysis
Given yesterday's sell-off, let's check in on the US averages to see where we are in relation to key levels

The IWMs are the worst off -- which is to be expected as they're the riskiest of the averages. However, prices are only down about 10% from their highs in late Market. Prices are under the 200 day EMA. They recently formed a relief rally, but hit resistance at the 20 day EMA. The most important level here is the 74.25 level; a move below that make the next logical price target a bit above 70.

The QQQs found support at the 200 day EMA -- which was also just below the 50% Fib level. Right now the big technical support is to be found at the 200 day EMA; a move through that level would lead to the 59.50 level being the next logical level of support. Also note: the QQQs have only dropped about 10.5%.

The SPYs are right above the 200 day EMA. Like the other averages, they rallied over the last week, only to drop yesterday. However, the SPYs have only dropped about 7.75% from their highs. But, like the QQQs and IWMs, we see a deteriorating technical situation: declining MACD, negative CMF and increased volatility.
Two of the above averages have hit the "correction" level -- a drop of 10% or more. However, the SPYs are still lagging that drop.

The dollar has moved through the 61.8% Fib level of the long, 2010-1012 sell-off. Prices have also moved through the highs established at the beginning of the year and the 200 week EMA. The dollar is benefiting from the safety trade as traders flee the euro. The next logical price target is right below the 23.5 level.

The IWMs are the worst off -- which is to be expected as they're the riskiest of the averages. However, prices are only down about 10% from their highs in late Market. Prices are under the 200 day EMA. They recently formed a relief rally, but hit resistance at the 20 day EMA. The most important level here is the 74.25 level; a move below that make the next logical price target a bit above 70.

The QQQs found support at the 200 day EMA -- which was also just below the 50% Fib level. Right now the big technical support is to be found at the 200 day EMA; a move through that level would lead to the 59.50 level being the next logical level of support. Also note: the QQQs have only dropped about 10.5%.

The SPYs are right above the 200 day EMA. Like the other averages, they rallied over the last week, only to drop yesterday. However, the SPYs have only dropped about 7.75% from their highs. But, like the QQQs and IWMs, we see a deteriorating technical situation: declining MACD, negative CMF and increased volatility.
Two of the above averages have hit the "correction" level -- a drop of 10% or more. However, the SPYs are still lagging that drop.

The dollar has moved through the 61.8% Fib level of the long, 2010-1012 sell-off. Prices have also moved through the highs established at the beginning of the year and the 200 week EMA. The dollar is benefiting from the safety trade as traders flee the euro. The next logical price target is right below the 23.5 level.
Wednesday, May 30, 2012
Bonddad Linkfest
- Italian and Spanish yields increase at recent auction (FT)
- GOP anti-tax rhetoric is softening (Politico)
- Euro Commission Reports spark EU equity market rally (Reuters)
- Economists expect a 50BP cut in Brazilian interest rates (Reuters)
- Economic sentiment drops in the EU (Europa)
- EU business climate continues to drop (Europa)
- Texas production index holds steady (Dallas Fed)
- Dryness may lower western Australian crop yield (Agrimoney)
- Emerging markets are faltering (Marketwatch)
- US consumer confidence falls (Marketwatch)
The Exact Wrong Policy Proscription Regarding Education
From Carpe Diem:
For reasons unknown, the US political right has a big problem with educating people. Whether it's the "threat of liberal indoctrination" (ever talked with professors in the business school ?) or some other such nonsense, the lack of respect for education and educational achievement is palpable -- and grows more and more every year.
The problem with the above statement is this chart:

The more educational achievement you have, the lower your unemployment rate. And this is not a matter of .5% here and there, it's a noticeable difference.
"The college-for-all crusade has outlived its usefulness. Time to ditch it. Like the crusade to make all Americans homeowners, it’s now doing more harm than good. It looms as the largest mistake in educational policy since World War II, even though higher education’s expansion also ranks as one of America’s great postwar triumphs.
.....
MP: The chart above shows graphically the results of the "college-for-all crusade." In the 1970s and 1980s only about one out of three high school graduates went on to college. Now about half of all high school graduates attend college. And most of them now graduate with student loan debt of $25,000 and many are having a hard time finding a job.
For reasons unknown, the US political right has a big problem with educating people. Whether it's the "threat of liberal indoctrination" (ever talked with professors in the business school ?) or some other such nonsense, the lack of respect for education and educational achievement is palpable -- and grows more and more every year.
The problem with the above statement is this chart:

The more educational achievement you have, the lower your unemployment rate. And this is not a matter of .5% here and there, it's a noticeable difference.
Why Are the BRICs -- and the Slowdown of China and India -- So Important
Over the last month or so, we've seen stories that the two big BRIC economies of India and China are slowing down. However, a fundamental question that we have not answered is this: why are the BRICs -- and more importantly India and China -- so important?
The first answer is population. Consider these charts of total population:


The combined total of the Chinese and Indian population is about 2.5 billion. That comprises about 37% of the world's 6.8 billion population -- a very significant number. More importantly, that number is 66% of the population of the 10 largest economies in the world.
In addition, from a purchasing power parity perspective, China is the third largest and India is the fourth largest economy in the world.
A slowdown that effects this many people is bound to hurt. And, most importantly, there are no countries of comparable size to take the reins.
The first answer is population. Consider these charts of total population:


The combined total of the Chinese and Indian population is about 2.5 billion. That comprises about 37% of the world's 6.8 billion population -- a very significant number. More importantly, that number is 66% of the population of the 10 largest economies in the world.
In addition, from a purchasing power parity perspective, China is the third largest and India is the fourth largest economy in the world.
A slowdown that effects this many people is bound to hurt. And, most importantly, there are no countries of comparable size to take the reins.
Morning Market Analysis

The technology sector is the largest sector of the SPY's accounting for a little under 20% of the average. Overall, this sector has dropped about 7.4%. Prices are right about the 200 day EMA and are also being hemmed in by the 10 and 20 day EMA. Also note the declining momentum and CMF. The real issue with this chart is the 200 day EMA; so long as prices stay above/near that level, I don't see any major problems.
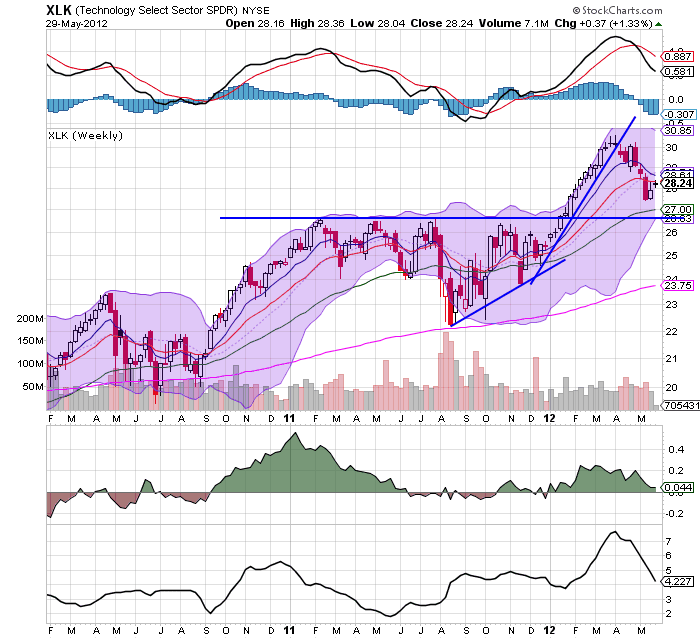
However, the weekly chart says the 26.75 price level is the most logical price target for this sector.

The XLFs (which comprise 14% of the SPYs) have broken through the 200 day EMA. Prices are currently in a rebound rally, but the deteriorating technicals (dropping MACD and CMF) tell us that the rally is purely technical. the 13.6 level (the 38.2% Fib level) is key; a move through that level would send the average lower.

The weekly XLF chart is also deteriorating; the MACD has given a sell signal and the CMF is declining. Prices rallied to the 200 week EMA, but were rebuffed. Prices are right at the 61.8% Fib level, but are contained by the 10, 20 and 50 week EMA.

The XLV, which account for 11.8% of the SPYs, are in a slightly downward sloping channel. But they have found strong support at the 81.8% Fib level.

The weekly chart shows that prices are at support levels established in mid-2011.
The two largest areas of the market -- technology and finance -- are clearly correcting. However, both have support on their respective weekly charts. The health care sector is moving lower, but its movement could also be classified as a holding pattern.
Tuesday, May 29, 2012
Bonddad Linkfest
- Republican Keynseians (NYT)
- The UK/Euro Connection (FT Alphaville)
- US consumer sentiment increases (Marketwatch)
- Interview with Canadian Banking Regulator (Marketwatch)
- UK devises contingency plans (FT)
- Weaker euro should boost EU exports (FT)
- Japanese unemployment at 4.6% SA (JSB)
- German inflation drops (BB)
Unemployment Benefits Start to Get Cut
This is not the proper way to deal with this situation:
The checks are stopping for the people who have the most difficulty finding work: the long-term unemployed. More than five million people have been out of work for longer than half a year. Federal benefit extensions, which supplemented state funds for payments up to 99 weeks, were intended to tide over the unemployed until the job market improved.
In February, when the program was set to expire, Congress renewed it, but also phased in a reduction of the number of weeks of extended aid and effectively made it more difficult for states to qualify for the maximum aid. Since then, the jobless in 23 states have lost up to five months’ worth of benefits.Next month, an additional 70,000 people will lose benefits earlier than they presumed, bringing the number of people cut off prematurely this year to close to half a million, according to the National Employment Law Project. That estimate does not include people who simply exhausted the weeks of benefits they were entitled to.Separate from the Congressional action, some states are making it harder to qualify for the first few months of benefits, which are covered by taxes on employers. Florida, where the jobless rate is 8.7 percent, has cut the number of weeks it will pay and changed its application procedures, with more than half of all applicants now being denied.
Subscribe to:
Posts (Atom)