Tuesday, March 13, 2012

BRICs, Part II: Brazil

From the CIA World Fact Book:
Characterized by large and well-developed agricultural, mining, manufacturing, and service sectors, Brazil's economy outweighs that of all other South American countries, and Brazil is expanding its presence in world markets. Since 2003, Brazil has steadily improved its macroeconomic stability, building up foreign reserves, and reducing its debt profile by shifting its debt burden toward real denominated and domestically held instruments. In 2008, Brazil became a net external creditor and two ratings agencies awarded investment grade status to its debt. After record growth in 2007 and 2008, the onset of the global financial crisis hit Brazil in September 2008. Brazil experienced two quarters of recession, as global demand for Brazil's commodity-based exports dwindled and external credit dried up. However, Brazil was one of the first emerging markets to begin a recovery. In 2010 consumer and investor confidence revived and GDP growth reached 7.5%, the highest growth rate in the past 25 years. Brazil has since then experienced an economic slowdown, driven primarily by a faltering industrial sector and Brazil's fast-rising currency. Brazil's high interest rates make it an attractive destination for foreign investors. Large capital inflows over the past several years have contributed to the rapid appreciation of its currency and led the government to raise taxes on some foreign investments. President Dilma ROUSSEFF has pledged to retain the previous administration's commitment to inflation targeting by the central bank, a floating exchange rate, and fiscal restraint.

Here's how their economy breaks down:

agriculture: 20%
industry: 14%
services: 66% (2003 est.)

According to the same source, Brazil is the 24th largest exporter and the ninth largest oil exporter.  Their primary agricultural products are: coffee, soybeans, wheat, rice, corn, sugarcane, cocoa, citrus; beef.


The Brazilian economy was stagnant at the end of the 1990s and early 2000s.  However, starting in 2004, we see the country grow at incredibly strong rates, with the recession of 2010 being the only thing holding back the growth.  


While the economy came out of the recession printing very strong growth, notice that the rate of growth has been steadily decreasing for the last two years.  


Brazilian industrial production's YOY increase is now negative, indicating a clearly slowing economy.


Brazil's retail sales numbers are actually pretty good, indicating the Brazilian consumer is alive and well.


The above charts are obviously inter-related.  Brazilian inflation peaked at a little under 7.5% late last year, but has been coming down since then.  As a result, Brazil has been able to lower their benchmark interest rate -- which is very high by world standards.


Over the last few years, the unemployment rate has been dropping.

The inflation/interest rate charts are very important, because they show the big problem Brazil is facing right now: rising inflation has kept rates high which is having an obviously negative impact on the economy.


Morning Market Analysis


Industrial metals are still in a sideways pattern, rotating around the 200 day EMA.  We see support at the 20.25 level and resistance at 21.50.   The big issue with this chart is the declining momentum, which has been moving lower since the beginning of February. 


The grain market is right at the 200 day EMA, and is trapped by resistance.  However, a move about 47 would lead to some decent upside moves. Here, notice two technical developments.  First, we see a big volume spike yesterday, which is bullish.  However, the MACD shows a fairly weak momentum picture. 


Oil is consolidating gains in a downward sloping pennant pattern.  There is upside resistance at the 107.5 level (where the upper channel line is) along with the 110 level.  However, momentum is declining and the shorter EMAs have lower slopes.

If traders were betting on strong world wide growth, we'd be seeing far more bullish charts from industrial metals and oil.  But, China printed a trade deficit in their last report, Brazil is slowing down and US growth projections are still low.   Grains are a different story, but there are two other issues at play there.  First, prices are at low levels so, their spikes would be painful.  Secondly, a price spike there would be less about growing economies and more about the rising middle class in a other countries.


After hitting resistance, the real has dropped sharply over the last few weeks.  The shorter EMAs are both moving lower and are about to cross over the 50 day EMA.  Momentum is also declining.  This was caused by the slowing of the economy and the latest interest rate cut by the  Brazilian Central Bank.


Unlike the real, the Rupee is not in free fall, but has formed a downward sloping pennant pattern in February.


Monday, March 12, 2012

Bonddad Linkfest

  1. India loosens monetary policy (FT)
  2. Latest quarterly banking profile from the FDIC (FDIC) 
  3. Latest stress tests should show progress (NYT)
  4. Medicare spending is slowing (TPM)
  5. Greek bonds trading at distressed levels (FT)
  6. Corporate bond issuance is doing very well (FT)
  7. Baby boomers are driving down LPR (Forbes)
  8. India's on again, off again cotton ban (FT)
  9. China posts trade deficit (WSJ)
  10. Portugal's bonds still see a spike in yield (BB)

Uh oh: Gallup YoY consumer spending has turned negative

- by New Deal democrat

Gallup's daily economic polling really "earned its bones" last year. The daily confidence numbers held up quite well before deteriorating slightly in June and then collapsing in July, bottoming in the beginning of August when the US's debt was downgraded. This showed that the debt ceiling debacle had a major impact on the public. Confidence has slowly returned and is now near a one year high.

In order to see if the collapse in confidence translated into a real change in consumer behavior, I tracked Gallup's daily consumer spending throughout the August-October period. It showed that consumer spending held up like a champ. Consumers may have lost faith in their government, but they continued to believe in their wallets. This data was the biggest single clue that ECRI's September call that a recession was imminent or may have already begun, was wrong.

So it is with no small concern that I report that YoY consumer spending as measured by Gallup's polling has turned negative YoY in the 14-day rolling average for 6 out of the last 7 days. Here's the graph:


The 3 day average is very volatile, but one year ago the 14 day average had just climbed to $70. This data has to be looked at YoY because seasonality is so strong. Consumer spending ramps up for Christmas and for back-to-school. It eases off in September-October and again in January.

I don't want to over-sell this. YoY declines have briefly occurred several times during the recovery. In particular, consumers binged on Christmas spending in December 2010. The hangover was the next month, January 2011, when spending came in less than January 2010. Because of comparisons with that same binge, December 2011 was slightly weaker than December 2010.

This YoY negative comparison just started one week ago, and it could be that the non-winter winter pulled some spring spending forward into February (which would also mean that February was actually weaker than it looked). Nevertheless, this weakness occurs precisely at the time when we are on the lookout for gas prices to start to bite into consumer spending and so it raises yet another yellow flag, and only adds to the importance of tomorrow's February retail sales report.

The BRIC Countries, Part I


The above chart shows the 10 largest world economics according to the CIA World Fact Book.  Some of these numbers are from the end of last year, so some ranks could have changed (for example, I believe some ranking systems now have Brazil at 6).  However, you get the general idea.  More importantly, it puts the importance of the BRIC countries in perspective.  All four are on the list, and all four are considered hot markets.

More importantly, all four are incredibly important to the latest expansion -- a trend I first noted back in 2008: 
As US consumer spending slows we will import less, thereby lowering the total amount of imports in the trade deficit formula. At the same time, Emerging economies have seen a growing middle class which will want to buy more goods and services. And some of those will come from the US
And as I've noted, the exports have been a key component of the latest expansion, as shown by this chart from the BEA:


Early in the expansion, exports were a primary driver of growth.  In 2010, they were important contributors and in the first quarter of 2011 there were in fact a larger contributor than overall GDP.  Their significance has dropped off since than.

And this chart from the FRED system shows that exports are alive and well in the US:


As the chart above shows, exports are clearly in a "v" shaped recovery.

In addition, non-OECD countries are more and more important to overall world growth:


However, a recent WSJ article highlights that the BRIC economies are slowing:
Earlier this week, Brazil said its economy grew around 2.7% in 2011, less than half the rate the government predicted a year ago. And Wednesday, Brazil said industrial production fell 2.1% in January, the most since the 2008 crisis. Later, Brazil's central bank slashed its benchmark interest rate by three-quarters of a percentage point, a bigger cut than expected, to spur growth.
.....
Growth forecasts are falling across the developing world. On Monday, China's Premier Wen Jiabao reduced the country's annual growth target to 7.5% after keeping it at 8% since 2005. Last week, India said its economy grew 6.1% in the final quarter of 2011, its slowest pace in two years. Economists expect South Africa's growth to slow to 2.5% this year, a far cry from the 7% rate its central-bank governor, Gill Marcus, spoke of chasing just a year ago in order to dent high unemployment.

To be sure, most of the world's developing economies are still cruising faster than the U.S., Europe and Japan. Foreign investment in the regions is recovering, and rising commodity prices should help growth in resource-rich nations like mining giant South Africa and Brazil, a major exporter of iron ore, soy, beef and other goods.

"The emerging markets are still at the front of the train, but it's a slower-moving train," said Mohamed El-Erian, chief executive of Pacific Investment Management Co., which manages some $1.3 trillion in bonds
.....
India is also wrestling with the fallout from slower-than-predicted growth. Some analysts say it was caught off guard by its slowdown, which made expensive promises of social spending and fuel subsidies harder to afford. A year ago, India predicted it would notch 9% growth for the year ending March 2012, its fiscal year. Recently it cut the forecast to 7%.

The government will be hard pressed to pay for the subsidies without opening up wider budget deficits. But the government may be forced to go deeper into the red to fund more subsidy programs to maintain popularity.
This week, I'm going to take a macro-look at the four BRIC countries-- Brazil, Russian, India and China.  I'll be using information from the CIA World Fact Book, the Trading Economies Website, the OECD and World Bank.   The point is to develop a more in-depth knowledge of the various countries and hopefully carry that knowledge forward for future reference. 


Morning Market Analysis

As a review, my central thesis of the market is that we're technically overbought.  As such, the equity markets are looking at a period of correction or sideways consolidation (we don't know which yet).  Either way, that means we need to be on the lookout for technically important levels to support the market and be wary of the time when prices move through these levels.  We also need to look at other markets (like the treasury market) as these either provide a safe haven refuge for traders or a source of further fuel for a future rally.

Let's start with why I think the market is overbought:


In both the S&P 500 and NASDAQ 1000, over 80% of all stocks are over the 200 day EMA.  While that does indicate we're in a bull market, it also indicates we've probably seen plenty of gains and that traders are now looking for profits.


The IWMs represent riskier stocks, so they should be the first to gain when it looks like the economy is picking and and the first to fall when traders are concerned.  Prices have fallen through short-term support at ~81.  We have short term support at the 10 and 20 week EMAs -- both of which are still rising.  The MACD is still positive, although it is now moving sideways.  The A/D and CMF show money is still flowing into the market.


The QQQs are the best looking market, technically.  However, last week, prices printed a "hanging man" candle, which many traders consider to be a reversal bar.  However, all the technicals are also still positive here.


The SPYs have broken through resistance and are still heading higher.  However, last week the weekly chart printed a hanging man pattern (see above).  But, all the other technical indicators are still positive -- the EMAs are moving higher, the MACD is positive and rising and the volume indicators show money is flowing into the market.

None of the weekly charts are bearish.  The least bullish are the IWMs, but that charts underlying technicals are good.


The top chart is the IWM daily chart, which shows that prices broke support, hit the 50 day EMA and rallied.  The lower chart shows that prices rallied through Fib levels last week, but fell back to the 61.8% level by Friday's close.


The treasury market is still either above support or in a trading range.  This is important because this is where the safe money is resting.


While the dollar rallied last wee, the real trading pattern is that it's currently trading around the 200 day EMA.  On one hand, the more bullish US data is feeding the bulls, but the fed's stance is feeding the bears.

So, we're in a continuation of last week.  Stocks are selling off, but we are hardly in a danger position.  New cash is needed, but the treasury market isn't going to provide it.


Sunday, March 11, 2012

100 False Prophecies by the Pied Piper of Doom: 11-19, bankrupties are gonna crash and burn the economy! (1)

- by New Deal democrat

Introductory note: For those of you who aren't aware of the past history of the bloggers here with Daily Kos, or don't want to hear more about it, please pass on. Regular economic blogging will resume tomorrow. For those of you who do, put some popcorn in the microwave or pour a nice libation and enjoy ths following Sunday reading.

Once again I request that you not cross-post this. Unfortunately you're not going to change anyone's mind. I simply decided that rather than having this sit unpublished in my computer, a record should be available.


This installment turned out to be so long, I've had to split it into two sections. This is the first section. Here is last week's post with the first 10 false prophecies.
==========

The Pied Piper of Doom has been very sure that, well, just about everything is on the brink of bankruptcy that will surely cast the economy into the abyss.

11. In May 2009 he claimed that there were going to be
upcoming six-figure job losses certain to occur throughout the auto industry
Obama was able to arrange for the prepackaged bankruptcy of GM and Chrysler. Those 6-figure layoffs never happened.
He was wrong.

12. On July 21, 2009 he claimed that CIT corporation would go bankrupt and throw the economy into the abyss:
the CIT Group bailout may collapse over the next few days, despite the recent hoopla about the private sector's so-called (feeble) attempt to support an entity that represents one of the most important sources--if not the most important source--of financing for a good portion of Main Street.
We're talking 300,000 small business--out of the almost one million served by CIT--in jeopardy of closing their doors in coming days or weeks as a result of this "not-too-big-to-fail" mentality being deployed by our government's pretzel logic right now.

...Our government's indicating Main Street's expendable! " See: "Treasury Bets U.S. Financial System Can Weather CIT Collapse."

Businesses are closing their doors due to this, and it isn't even official! See: "Alabama Tool Supplier Blames CIT Woes for Bankruptcy."

Now multiply that times 300,000... Gone. Do you know what this will do to the unemployment numbers in coming weeks and months?
CIT did declare bankruptcy, and not one of his apocalyptic predictions came to pass.
He was wrong.

13. The next day he said:
The disparity between the "happy news" crowd's call for an imminent economic recovery simply doesn't jive with their occasionally (more) sober comments regarding stark Main Street realities.
Backed into a corner, with the imminent closing of no less than 300,000 of their almost one million Main Street small business clients (accounting for, perhaps, millions of existing jobs in the retail and manufacturing sectors) on the line, CIT Group senior management agreed to "Don Corleone financing" terms, accepting 'an offer they couldn't refuse' that guaranteed an immediate $100 million-plus profit to the PIMCO-led vulture capital group the moment the ink hit the bondholder agreement documents.
He was still wrong.

14. On September 9, 2009 he claimed that The Auto Sector was going to tank:
And, of course, there are the government programs to support our ailing auto and housing sectors...note the first sentence of the story, below...today we heard that Ford's sales were up 17% last month...but...wait a minute...GM and Chrysler were down? It will be very interesting to follow car sales over the next few months. The sales volume will fall, as the stimulus to buy is no longer there. The question will be: " Did the clunker program just steal from future consumption, or has there been a permanent increase in demand that reflects a stronger economy? My bet is that the demand is going to fall flat. I visited a car dealer on Tuesday and they had not seen a customer. Without the rebate there are no buyers. We're told things are looking up; but these statements are based upon slight upticks in manufacturing indices which are only temporarily inflated by short-term government programs. Both the retail auto and housing sectors are, indeed, projected to continue to tank after the federal supports are withdrawn.
Auto sales fell for only one month, and then resumed their upswing, hitting 11 million by spring 2010, 12 million by autumn, and as of last month, 15 million.

Yeah, he was wrong.

15. 10 days later, he claimed:
The cash-for-clunkers program, in view of even near-term sustainability of auto sales, was a failure. Comments coming from senior industry analysts with regard to September sales are far beyond even awful.
Yeah, you know. Still wrong.

16. Remember the commercial real estate catastrophe? In March 2010 he said:
the commercial real estate (CRE) bust will do more to undermine an already-struggling small business environment than most realize, simply because Main Street businesses have always relied upon the mid-sized and small community banks for the lion's share of their credit needs, and these are the same banks that are going to feel the brunt of the CRE meltdown
The CRE meltdown never happened.
He was wrong.

17. Or how about the catastrophe of Christmas 2010 caused by the SBA failing to make loans? In July 2010 he said:
It creates a brutal, cascading effect upon U.S. small business, of course. (Both directly and indirectly.) So, when I read articles like this, "SBA Lending Cliff Dives in June, Boding Ill for Employment," from Naked Capitalism, today, it's disconcerting, to say the least.
....
[quoting Naked Capitalism] Christmas-related spending is a big boost for much of the economy; businesses need to buy supplies and produce/carry inventory in advance of Christmas orders. Limited access to funding in the runup to this critical selling season would be particularly damaging.
Didn't happen.
He was wrong.

18. Remember how BP had to declare bankruptcy and crashed the economy? During the gulf oil disaster he said:
Stories have been circulating over the past few days that BP may be looking at its bankruptcy options as the only way out of its self-made travesty in the Gulf of Mexico. But, in the past hour, according to an interview with top oil and gas consultant Matt Simmons, just posted on Fortune Magazine's website, it now appears that the possibility that BP will file bankruptcy very soon is quite real.
BP didn't declare bankruptcy.
He was wrong.

19. Remember how the commercial real estate disaster took down over 1/3 of the nation's banks? The Pied Piper claimed:
due to the just-commencing downturn in commercial real estate (CRE), approximately 3,000 of our nation's 8,000 banks are at risk of insolvency in the course of the next 36 months. In what's just the first inning of a rather massive commercial real estate bust, it's really all about how this will affect these banks that just happen to be the same banks that have been the traditional source for capital for much of our nation's small business

.... the double-dip Great Recession, the meme that even some of the blogosphere's most optimistic pundits downplayed up until just the past few weeks...
That didn't happen either.
He was wrong.

To be continued ... and continued ... and continued ....

Saturday, March 10, 2012

Weekly Indicators: spring storm watch edition

- by New Deal democrat

Monthly releases were dominated by the payrolls report, which disappointed only in that it wasn't more of a blowout than January, which was revised up to +284,000 jobs. The household survey showed over 400,000 jobs added. This survey has shown a surge of 2.448 million jobs in the last 8 months, worth noting because the household survey often leads at inflection points. The participation rate increased 0.2%. Had it remained constant, the unemployment rate would have fallen to 8.0%. The manufacturing workweek, a leading indicator, increased.

In other news, factory orders declined but less than anticipated. Labor productivity stalled, which is actually good for the addition of more jobs.

Turning to the high frequency weekly indicators which I watch because any turning pointwill show up in these indicators first. This week they were all mixed up, but importantly several warning flags of flagging consumer demand in the face of rising gas prices have been raised.

Let's review from positive to negative.

Housing reports were positive:

The Mortgage Bankers' Association reported that the seasonally adjusted Purchase Index increased +2.1% from the prior week, although it was still -7.8% lower YoY. This continues its rebound from the bottom of its nearly two year range. The Refinance Index decreased -2.0% from the previous week, still near its highest level in over half a year.

YoY weekly median asking house prices from 54 metropolitan areas at Housing Tracker were again up +3.9%. This number has stabilized on a YoY basis for a month, which is what I would have expected. It remains at odds with the Case-Shiller reports of worsening YoY declines in price for comparable sales. One of the two is going to turn.

Bond prices and credit spreads also improved:

Weekly BAA commercial bond rates declined -0.8% t0 5.07%. Yields on 10 year treasury bonds fell -0.4% to 1.97%. The credit spread between the two, which had a 52 week maximum difference of 3.34% in October, tightened again this past week to 3.11%. Once again, narrowing credit spreads are not at all what I would expect to see if we were going into a recession.

Employment related indicators were positive or neutral:

The Daily Treasury Statement showed that for the last 20 reporting days ending 6 days into March, on March 8, 2012, $156.7 B was collected vs. $152.1 B for the eequivalent 20 day period in 2011, an increase of 3.0%..

The American Staffing Association Index rose to 87 again last week. It remains midway between its 2011 and 2007 levels. Seasonally we want to see this move slightly higher over the next few weeks.

The Department of Labor reported that Initial jobless claims rose to 362,000 last week. The four week average increased 1000 by 355,000. These are still close to the lowest reading since spring 2008.

Sales remained positive, but one report flashed a warning. The ICSC reported that same store sales for the week ending March 3 rose +1.3% w/w, and also rose only +1.7% YoY. Shoppertrak did not report. Johnson Redbook reported a 3.0% YoY gain. Last week I said that "these reports have taken on added significance. If the consumer is beginning to fold, I would expect to see YoY comparisons under 2% as a warning signal." This week we got one such signal. Only one report and only one week, but it raises a yellow flag to pay extra attention.

Money supply was flat to slightly negative:

M1 declined -0.2% last week, and also fell -0.4% month over month. On a YoY basis it fell to +18.5%, so Real M1 is up 15.6%. YoY. M2 was flat for the week, and rose a tiny +0.1% month over month. Its YoY advance fell to +9.8%, so Real M2 was up 6.91%. In short, real money supply indicators continue slightly less strongly positive on a YoY basis, although not so much as in previous months, and have generally stalled in the last couple of months.

Rail traffic was negative but with an explanation. The American Association of Railroads reported a 5000 car decline in weekly rail traffic YoY for the week ending March 3, 2012. Intermoal traffic was up 13,000 carloads, or +6.0%, but other carloads decreased 19,000, or -6.2% YoY. Last week I included a graph from Railfax and said it would be troublesome if the data did not turn up. This week it turned up. The entire decline in carloads is due to coal shipments which were off 23,000 carloads or -16.6%. It appears that a warm winder, coupled with cheap natural gas prices, caused a cliff-dive in demand from power stations. Still, the decline in mining and shipment of coal is still a decline in economic activity.

Gasoline prices are more than 10% higher than one year ago while usage continues to be much lower: Oil rose slightly to $107.40. Gas at the pump rose another $.07 to $3.79. Both of these are significantly above the point where they can be expected to exert a constricting influence on the economy. Gasoline usage, at 8262 M gallons vs. 9192 M a year ago, was off -10.1%. The 4 week moving average is off -7.8%. These are the most severe YoY declines since they began last March. Last week I said that a YoY decline for more than 10% for one week, or a 4 week average decline in excess of 7.5%, would be warning signals that the Oil choke collar was having an effect. This week we got both.

Finally, the JoC ECRI industrial commodities index fell from 128.13 to 126.00. This is a strong decline in what is almost certainly the most heavily weighted component of ECRI's WLI, and suggests there will be a significant decline when that index is reported next Friday.

Turning now to high frequency indicators for the global economy:

The TED spread is at 0.390 down from 0.410 week over week. This index remians slightly below its 2010 peak, and has declined from its 3 year peak of 2 months ago. The one month LIBOR is at 0.242, down .001 from one week ago. It is well below its 12 month peak set 2 months ago, remains below its 2010 peak, and has returned to its typical background reading of the last 3 years.

The Baltic Dry Index at 824 was up 53 from 771 one week ago, and up 174 from its 52 week low, although still well off its October 52 week high of 2173. The Harpex Shipping Index was flat at 376 in the last week, still up 1 from its 52 week low. Please remember that these two indexes are influenced by supply as well as demand, and have generally been in a secular decline due to oversupply of ships for over half a decade. The Harpex index concentrates on container ships, and led at recent tops and lagged at troughs. The BDI concentrates on bulk shipments such as coal and grain, and lagged more at the top but turned up first at the 2009 trough.

This is a replay of last year, when Oil's choke collar brought an accelerating recovery to a virtual standstill. Most of the usual leading indicators continue to give positive signals. But the further cutback in gasoline usage, and the admittedly only one data point showing definite slowing in retail sales are like thunder in the distance. The most important report to watch this week will be Tuesday's retail sales. Expectations are high, for more than a 1.0% increase. An increase of +0.5% or higher, while "disappointing," will still most likely be positive after inflation is reported Friday. Any report of +0.2% or less, however, should be treated like a siren warning of an approaching storm.

Have a nice weekend.

Friday, March 9, 2012

Weekend Weimar, Beagle and Pit Bull

It's that time of the week. NDD will make a few posts this weekend. I'll be back on Monday. Have a happy and safe weekend. Until then ....


1954: Government Spending

The above chart places total federal spending in perspective; we see a big increase in spending as a result of the Korean War.  Then we see a continued increase in spending to stimulate the economy out of recession.  However, government spending drops throughout 1954.


In the above chart, we simply see the actual numbers for expenditures and receipts.


As the chart above shows, the government ran a deficit for the year.  However, we see that spending and revenue were equal in the 4Q.

Remember that there were a number of tax cuts that went into effect to get the economy out of recession.  

Remember -- tax rates were far higher during this decade.  In addition, the government spend a a fair amount of money in conjunction with the tax cuts as a way to increase income during the recession.  This led to an actual increase in overall net income at the national level, thereby helping to prevent the recession from continuing. 

Notice that, despite the tax cuts, we see a decrease in receipts:


Remember -- tax receipts closely track GDP.

Finally, regarding the federal debt, we have this:


Beige Book: Employment and BLS Employment Report

From the Beige Book:
Of the Districts reporting on hiring, most indicated a slight increase. Boston, New York, Cleveland, Richmond, St. Louis, and Minneapolis reported increased hiring in manufacturing, and contacts in Philadelphia and Kansas City anticipate future hiring in the sector. Several businesses in the Atlanta District also reported plans to increase payrolls. Philadelphia, Kansas City, and Dallas noted increased hiring among auto dealers. Contacts in Boston, Cleveland, Richmond, Chicago, Kansas City, and Dallas were having difficulties finding skilled or specialized workers in a variety of industries. In contrast, Boston manufacturing contacts reported fewer complaints about being unable to find qualified workers. Chicago noted that hiring remains selective and long-term unemployment elevated, while San Francisco noted limited demand for new workers. Staffing firms in Boston noted that the hiring cycle remains "elongated" despite stronger demand. Staffing firms in Dallas also noted high demand, while a major employment agency in New York indicated flat hiring.

Among Districts commenting on wages, upward pressures appeared limited. Boston noted limited pay rises in retail and manufacturing. Richmond reported some upward wage pressures in the service sector and manufacturing. Dallas and San Francisco reported minimal wage pressures, although upward pressure for certain specialized positions was reported in both Districts. Similarly, wage pressures remained largely subdued in Kansas City except for high-tech and energy positions. Wage pressures were modest or largely contained in Cleveland and Dallas, while Philadelphia noted flat wages and Minneapolis reported modest wage increases. New York noted that Wall Street compensation remains under downward pressure.
Let's look at some macro level data (which does not include the latest employment report):


Initial jobless claims have been below the 400,000 level for a few months now.  Notice the overall trend; claims dropped sharply right after the official end of the recession.  They leveled out at two levels -- first between 440,000 and 480,000 for the first 2/3 of 2020 and then between 400,000 and 440,000 for most of last year.


Total establishment jobs have been steadily moving upwards since about the middle of 2010.  While there is still a great deal of progress to be made, things are definitely on the right track.


The unemployment rate, which at its highest point was at 10%, is still far too high, but is moving in the right direction.

Let's break the establishment picture down into goods producing, service and government jobs:


Good producing jobs have increased over the last two years, but not by much.  This is part of the longer-trend issue of manufacturing becoming far more automated over the last twenty years.


Service sector jobs are clearly where most of the job growth has been over the last two years. accounting for a little over 2,000,000 jobs added.


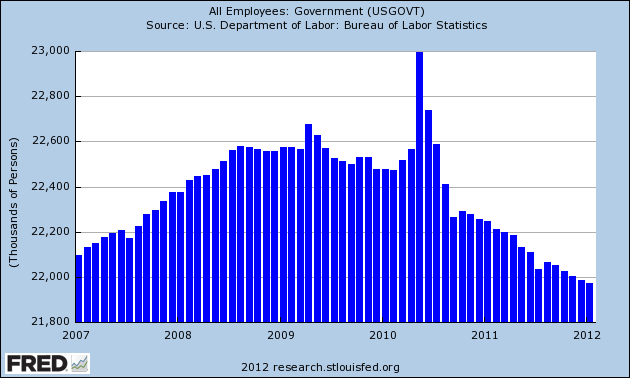
Note that government jobs continue to decline.  As I've stated before, I think this is the main reason for initial claims being at high levels for an extended period of time.

Now, onto the BLS report:


Nonfarm payroll employment rose by 227,000 in February, and the unemployment rate was unchanged at 8.3 percent, the U.S. Bureau of Labor Statistics reported today. Employment rose in professional and businesses services, health care and social assistance, leisure and hospitality, manufacturing, and mining.


First, overall these are good numbers.  We're over 200,000 in job growth and we're seeing broad based job growth.


The overall unemployment rate is clearly moving lower.  I've blocked off the establishment job growth chart into three areas.  At the end of 2010 and beginning of 2011 we see four of seven months increasing by over 200,000.  Then we see the rest of last year with sub-par growth.  This was caused by two events: Europe and high gas prices.  Over the last three months, we're back to where we were at the end of 2010/beginning of 2011.  The good news is Europe is less of an issue (at least for now).  Gas remains the wild card.

Let's turn to the household survey.


The number of unemployed persons, at 12.8 million, was essentially unchanged in February. The unemployment rate held at 8.3 percent, 0.8 percentage point below the August 2011 rate. (See table A-1.)

.....

The number of long-term unemployed (those jobless for 27 weeks and over) was little changed at 5.4 million in February. These individuals accounted for 42.6 percent of the unemployed. (See table A-12.)

 Both the labor force and employment rose in February. The civilian labor force participation rate, at 63.9 percent, and the employment-population ratio, at 58.6 percent, edged up over the month. (See table A-1.)

The number of persons employed part time for economic reasons (sometimes referred to as involuntary part-time workers) was essentially unchanged at 8.1 million in February. These individuals were working part time because their hours had been cut back or because they were unable to find a full-time job. (See table A-8.)

In February, 2.6 million persons were marginally attached to the labor force, essentially unchanged from a year earlier. (The data are not seasonally adjusted.) These individuals were not in the labor force, wanted and were available for work, and had looked for a job sometime in the prior 12 months. They were not counted as unemployed because they had not searched for work in the 4 weeks preceding the survey. (See table A-16.)


Overall, these are also good numbers.  First, note the rate of labor under-utilization is steady.  That's means that, at minimum, we're not getting any worse.  The LPR increased (much to the consternation of right wing "economic" commentators) as did the number of employed.  In fact, the household survey's employment numbers have been incredibly strong over the last few months. showing very strong gains.

Let's turn to the establishment survey:


Professional and business services added 82,000 jobs in February. Just over half of the increase occurred in temporary help services (+45,000). Job gains also occurred in computer systems design (+10,000) and in management and technical consulting services (+7,000). Employment in professional and business services has grown by 1.4 million since a recent low point in September 2009.

Health care and social assistance employment rose by 61,000 over the month. Within health care, ambulatory care services added 28,000 jobs, and hospital employment increased by 15,000. Over the past 12 months, health care employment has risen by 360,000. In February, social assistance employment edged up (+12,000).

In February, employment in leisure and hospitality increased by 44,000, with nearly all of the increase in food services and drinking places (+41,000). Since a recent low in February 2010, food services has added 531,000 jobs.

Manufacturing employment rose by 31,000 in February. All of the increase occurred in durable goods manufacturing, with job gains in fabricated metal products (+11,000), transportation equipment (+8,000), machinery (+5,000), and furniture and related products (+3,000). Durable goods manufacturing has added 444,000 jobs since a recent trough in January 2010.

In February, mining added 7,000 jobs, with most of the gain in support activities for mining (+5,000). Since a recent low in October 2009, mining employment has increased by 180,000.

Construction employment changed little in February, after 2 consecutive months of job gains.
Over the month, employment fell by 14,000 in nonresidential specialty trade contractors.

Overall, employment in retail trade changed little in February. A large job loss in general merchandise stores (-35,000) more than offset an increase in January (+23,000). Employment in motor vehicle and parts dealers continued to trend up in February.

Government employment was essentially unchanged in January and February. In 2011, government lost an average of 22,000 jobs per month.


Again -- we see broad based gains.

Finally, we go to wages and hours worked:


The average workweek for all employees on private nonfarm payrolls was unchanged at 34.5 hours in February. The manufacturing workweek edged up by 0.1 hour to 41.0 hours, and factory overtime was unchanged at 3.4 hours. The average workweek for production and nonsupervisory employees on private nonfarm payrolls edged up by 0.1 hour to 33.8 hours. (See tables B-2 and B-7.)

In February, average hourly earnings for all employees on private nonfarm payrolls rose by 3 cents, or 0.1 percent, to $23.31. Over the past 12 months, average hourly earnings have increased by 1.9 percent. In February, average hourly earnings of private-sector production and nonsupervisory employees rose by 3 cents, or 0.2 percent, to $19.64. (See tables B-3 and B-8.)


Here, we'd like to see more improvement.  However, with a high unemployment rate, we're not going to get a lot of supply side related issues on wages or hours.

Overall, 8 out of 10.  Good report.
==========================
NDD here with a few additional observations:

1. Like everybody else, I'm impressed with the upward revisions to December and January.  You don't get upward revisions like this in a weakening economy.  I suspect today's number will be upwardly revised as well.

2.  The manufacturing workweek, a leading indicator, ticked up another 0.1 to 41.0 hours.  Factory workers are working more hours than at any time in more than a decade.  This is a white hot number.

3.  The index of aggregate hours worked increased from 95.5 to 95.7.  Aggregate hours continue to outpace payroll reports, but are probably already beginning to be translated into a faster pace of increased jobs.

4.  The labor participation rate increased, even with more people entering the workforce.  This number is no longer bouncing along the bottom, but has significantly improved over the last half year or so.

But the most signficant overlooked number, in my opinion, is in the household report:

4.   The number of jobs added per the household report was 428,000.  Since this number is more volatile than the establishment survey number, it rarely gets reported.  But even after accounting for the population adjustment in January, according to this survey 2,448,000 new jobs have been created in the last 8 months!  That's over 300,000 a month. Since the household survey typically leads the establishment survey at inflection points, this is an extremely bullish development and argues for further upward revisions in the establishment survey.  In short, the household survey number shows that we are finally really making progress on the jobs lost ruding the recession.


Dear Rush: 851,000 Jobs Created in February!!!

Last month Rush Limbaugh (among many others on the "I will only report numbers that back up my worldview" train) made it very clear that he only trusts the non-seasonally adjusted job creation numbers from the Employment Situation Summary (this having nothing to do with the fact that January numbers are always in the negative millions thanks to holiday layoffs). So, I have challenged Mr. Limbaugh to only report the non-adjusted data for the rest of the year (I know, highly unlikely) and with this month being the first chance to do so, I wanted to point out that the non-adjusted gain for February (from the unadjusted January number) was a whopping +851,000 (or +740,000 if Rush prefers the Household Survey) jobs! That's right, in unadjusted terms, we had an absolutely blowout February for job creation in the United States.

Morning Market Analysis


Above are the charts for the treasury market, starting with the shortest maturity and going to the longest.  The shorter maturities are at support again, while the TLTs are approaching support.  The IEFs have a bit to go.  The point is money needs to leave the treasury market to provide fuel for the stock market to get the equity markets to stop correcting.  However, the charts above say that won't be happening yet.


The IWMs represent the riskiest areas of the equity market, so their position gives us an idea for where we might be in the correction cycle.  Prices have rebounded that last two days and are currently approaching both the 50% Fib level and  resistance established during February.


On the daily chart, prices have rebounded into the 10 and 20 day EMA -- both of which are heading lower.  Additionally, the 10 is now below the 20.  While the MACD is moving lower, the volume indicators are not showing a mass exodus from the market.


Note the QQQ's have risen to near previous highs.


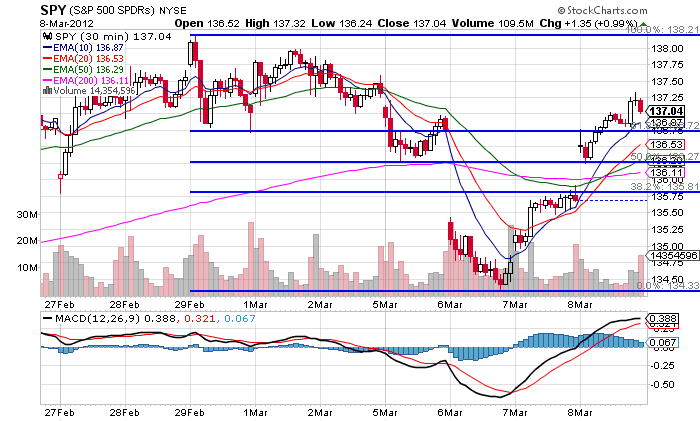
The SPYs, meanwhile, have rebounded above 30 minute Fib levels.


 The junk bond market has broken support and is headed for either the 50 day EMA or the support established in late October of last year.

Nothing in the above charts shows any kind of serious, long-term damage to the markets.  Instead, everything looks like the standard sell-off in the middle of a rally.