Friday, February 24, 2012

Prepare for less than 8% unemployment

- by New Deal democrat

As I've pointed out a number of times, the initial jobless claims rate, i.e., the percentage of the population filing for first time unemployment, has for 50 years (as long as the statistic has been reported) had a leading, and a tightly fitting relationship to the unemployment rate.

Here's how these two statistics stand as of yesterday's initial claims report:
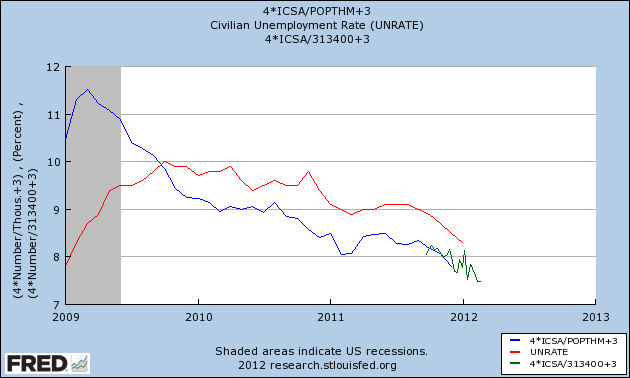


[Note: since the population series hasn't been updated since December, but has been growing by just under 200,000 a month, I added 300,000 to average January and February and then divided the most recent weekly claims by that number, in green].

Since the initial jobless claims rate tends to lead the unemployment rate by about 3 months, we should see unemployment at under 8% by no later than the May payrolls report. I anticipate at least another 0.1% decline in the unemployment rate, to 8.2%, to be reported next week.

Further, as I said yesterday, if the relationship between initial claims and payrolls in this recovery holds (a 27,500 gain in monthly payrolls for every 10,000 decline in the monthly average of initial claims), I expect February payrolls to be somewhere in the vicinity of +290,000, although there is enormous variability (+/-75,000) around the trend.

How Long Have People Been Unemployed?


The above chart shows the median amount of time people have been unemployed.  Notice this level has not dropped in a significant way, showing there is still a basic problem in the employment situation.


And while the number of unemployed 15 weeks and longer is dropping, it is still at very high levels, as is


The number unemployed for 27 weeks and longer.

The above charts show that we still have much progress to make.

Morning Market Analysis: Is It Time For a Correction?


Both the SPYs and the QQQs are right at support.  Both also have MACDs are are close to giving sell signals.  In addition, the SPYs MACD shows that momentum is slowing.  Combine that that with this:


The transports are moving lower in a disciplined manner, approaching late October highs.

In short it appears that the market is moving closer to a disciplined correction.  


The IWMs are moving in a sideways consolidation with a declining MACD.

Add to all that the following charts from Bespoke investment group, shows that sectors are filled with stocks in an over sold position.


Let me add this to sum up: I still think we're in an upward moving market.  However, I also think we're closing in on a short-term correction.