Equities: As I mentioned this morning, watch the rebound from the lows to see where stocks hit resistance. Then see if they retest lows or keep going. Right now stocks have a tremendous amount of upside resistance -- they are beneath all the EMAs, so moving higher is an incredibly difficult task.
Bonds: just the opposite. Do they hold gains or sell off? I would expect some sell-off, if simply to take profit. But where to bonds find support? Again, look to the EMAs.
In both cases, I'm not expecting any more wild rides, save for one caused by an unexpected, unforeseen event. Right now, EMAs are very important for both technical support and resistance reasons.
I'm thinking markets are in a "pause" mode. Stocks have cleared out some dead wood and parked proceeds into fixed-income for now. Traders are now watching fundamental events to get an idea for where to move next.
Monday, August 15, 2011
NY Empire State Continues to Weaken
From the NY Fed:
This was one of the first regional manufacturing surveys to show weakness, and its continued negative prints increases my concern. Notice the internals continue to decrease -- especially the new orders number.
At this point, it appears the manufacturing weakness that started with the Japanese earthquake is continuing.
The August Empire State Manufacturing Survey indicates that conditions for New York manufacturers continued to worsen. The general business conditions index fell four points to -7.7, its third consecutive negative reading. The new orders index also remained below zero, at -7.8, while the shipments index was positive at 3.0. The unfilled orders and inventories indexes dropped further into negative territory. Price indexes continued to retreat, with the prices paid index falling fifteen points to 28.3 and the prices received index falling three points to 2.2. The index for number of employees was slightly positive, while the average workweek index was slightly negative. Future indexes weakened significantly. The future general business conditions index plummeted twenty-four points to 8.7, its lowest level since February 2009, and the future new orders and shipments indexes, while positive, fell to near-record lows, exceeded only by their September 2001 readings. The capital expenditures index was also down sharply.
This was one of the first regional manufacturing surveys to show weakness, and its continued negative prints increases my concern. Notice the internals continue to decrease -- especially the new orders number.
At this point, it appears the manufacturing weakness that started with the Japanese earthquake is continuing.


Economic Week in Review
Consumer Spending: There were two news releases in this area of the economy. First, retail sales surprised to the upside, printing a .5% increase. There were some good surprises within the internals. First, auto sales were up .4%. Second, electronic and appliance stores increased 1.4%. I consider both of these areas to be signs of consumer bullishness, as they are both discretionary items. Consumer sentiment, on the other hand, dropped to levels last seen a few years ago. The obvious culprit of this is the debt debate of the last few months, so we could see a rebound now that a deal has been reached. However, there is still plenty of reason for consumer sentiment to stay at low levels. In addition, this statistic has yet to really move higher for most of the expansion, indicating consumers are still very distressed about the economy and future.
Manufacturing: Business inventories rose slightly -- by .3%. This tells us that businesses are keeping a tight lid of purchases, as they are probably concerned about the future and don't want to be left "holding the bag." Productivity fell .3% in the second quarter, which is a mixed blessing. It could indicate that businesses are finally at a point where they need to start hiring in order to increase productivity -- that is, business has already squeezed as much as they can out of existing employees and needs to add more to payrolls. Or, it could indicate that less demand is dropping output. My guess is it's a bit of both. The drop in initial unemployment claims shows that there is less of a reason to lay people off, but manufacturing also saw a drop over the last few months because of the Japanese situation.
The overall news was mixed. While the retail sales number was good, the drop in sentiment was deeply concerning, even though it could be a one month issue. Businesses are obviously trimming their wings. My reading of the productivity number is a net positive, but we'll have to wait and see if that translates into increased hires.
Manufacturing: Business inventories rose slightly -- by .3%. This tells us that businesses are keeping a tight lid of purchases, as they are probably concerned about the future and don't want to be left "holding the bag." Productivity fell .3% in the second quarter, which is a mixed blessing. It could indicate that businesses are finally at a point where they need to start hiring in order to increase productivity -- that is, business has already squeezed as much as they can out of existing employees and needs to add more to payrolls. Or, it could indicate that less demand is dropping output. My guess is it's a bit of both. The drop in initial unemployment claims shows that there is less of a reason to lay people off, but manufacturing also saw a drop over the last few months because of the Japanese situation.
The overall news was mixed. While the retail sales number was good, the drop in sentiment was deeply concerning, even though it could be a one month issue. Businesses are obviously trimming their wings. My reading of the productivity number is a net positive, but we'll have to wait and see if that translates into increased hires.
Equity Week in Review and Preview of the Upcoming Week/Month
Last week, I wrote the following about the markets:

Prices have found a bottom right above 112. They also formed a rounding bottom from last Monday to last Thursday, going sideways on Friday -- essentially, a consolidation of last week's price action. However, the sum total of last week's price action was consolidation.

The point and figure chart shows the importance of the 112 and 120 price level.

The daily price chart shows the crazy action of the last few weeks in detail. First, notice the volume increase over the last week or so, along with the declining volume over the last two days. The acceleration on the downside shows the selling pressure and the dropping volume on the last two days rally shows a decreased enthusiasm for the market. Prices now have strong upside resistance in the EMAs. Also note the 10 day EMA is right around 120, which is also a price level established on the P&F chart.
All three of the shorter EMAs are now moving lower at sharp degrees of descent, with the 50 day EMA the only shorter EMA not to cross below the 200 day EMA. All three will provide upside price resistance for the foreseeable future. Finally, notice that Friday's price action printed a spinning top -- a candle pattern that is not particularly bullish in its implications.

All of the technical indicators are negative. The A/D line and CMF both indicate money is leaving the market, while the declining MACD shows there is no upward momentum.
The good news is it looks as though the market found a temporary bottom. But we are hardly out of the woods. An upside testing of the declining EMAs is in order, followed by a retest of the 112 level. If the 112 level holds, we'll be in far better shape. But that bottom is new and still very tenuous. Any rally should be considered suspect until we see prices advance through the 200 day EMA. Any move below the 112 area should be shorted.
The volume, price action and confluence of price action with fundamental events is a clear warning sign to the markets. I would expect some type of price rebound at this point, but traders have moved from their consolidation range to a period of selling. There is clearly concern on the part of market players about the fundamental economic events driving and backing the market. Expect the EMAs to provide upside resistance to any price advance.In short, after finding some type of bottom, prices would rebound until they hit upside resistance, the most logical point of which would be the EMAs.

Prices have found a bottom right above 112. They also formed a rounding bottom from last Monday to last Thursday, going sideways on Friday -- essentially, a consolidation of last week's price action. However, the sum total of last week's price action was consolidation.

The point and figure chart shows the importance of the 112 and 120 price level.

The daily price chart shows the crazy action of the last few weeks in detail. First, notice the volume increase over the last week or so, along with the declining volume over the last two days. The acceleration on the downside shows the selling pressure and the dropping volume on the last two days rally shows a decreased enthusiasm for the market. Prices now have strong upside resistance in the EMAs. Also note the 10 day EMA is right around 120, which is also a price level established on the P&F chart.
All three of the shorter EMAs are now moving lower at sharp degrees of descent, with the 50 day EMA the only shorter EMA not to cross below the 200 day EMA. All three will provide upside price resistance for the foreseeable future. Finally, notice that Friday's price action printed a spinning top -- a candle pattern that is not particularly bullish in its implications.

All of the technical indicators are negative. The A/D line and CMF both indicate money is leaving the market, while the declining MACD shows there is no upward momentum.
The good news is it looks as though the market found a temporary bottom. But we are hardly out of the woods. An upside testing of the declining EMAs is in order, followed by a retest of the 112 level. If the 112 level holds, we'll be in far better shape. But that bottom is new and still very tenuous. Any rally should be considered suspect until we see prices advance through the 200 day EMA. Any move below the 112 area should be shorted.
Sunday, August 14, 2011
Blogging meta
- by New Deal democrat
Usually this blog goes quiet over the weekend. Bonddad and I were talking last night, however, and among other things noted that our traffic has gone up about 50% during the last couple of weeks.
If you are new to coming here or just started to return, you are probably seriously concerned by what has transpired in the last few weeks, and are looking for hard facts rather than hysteria. And given the fast moving nature of events in the last couple of weeks, timely is better. So this weekend I -expect to- (Edit: have post(ed)) several pieces, and by Tuesday at the latest my lengthy, graph- intensive overview of the economy. Hint: almost all the data is still going UP.
On a longer term note, both of us feel the need on our part, and the desire on your part, for us to state our opinions beyond summarizing the data. At the same time, I want to separate those two items. So my plan is to occasionally publish more opinionated, more political posts over the weekend, -possibly but not probably- (Update: done that too) starting this weekend. We'll see how it goes.
Usually this blog goes quiet over the weekend. Bonddad and I were talking last night, however, and among other things noted that our traffic has gone up about 50% during the last couple of weeks.
If you are new to coming here or just started to return, you are probably seriously concerned by what has transpired in the last few weeks, and are looking for hard facts rather than hysteria. And given the fast moving nature of events in the last couple of weeks, timely is better. So this weekend I -expect to- (Edit: have post(ed)) several pieces, and by Tuesday at the latest my lengthy, graph- intensive overview of the economy. Hint: almost all the data is still going UP.
On a longer term note, both of us feel the need on our part, and the desire on your part, for us to state our opinions beyond summarizing the data. At the same time, I want to separate those two items. So my plan is to occasionally publish more opinionated, more political posts over the weekend, -possibly but not probably- (Update: done that too) starting this weekend. We'll see how it goes.
Weekend political rant-ette: Obama's re-election platform
- by New Deal democrat
From this morning's NY Times article:
There will only be two material differences between Obama and whoever the GOP puts up:
1. What the GOPer will do sadistically, savagely, and with glee, Obama will do morosely and forelornly and regretfully because that's the only way to get a "bipartisan compromise" with the GOP.
2. Re-electing Obama guarantees a GOPer in 2016, whereas his losing means we might be able to elect a progressive in 2016.
From this morning's NY Times article:
"Administration officials, frustrated by the intransigence of House Republicans, have increasingly concluded that the best thing Mr. Obama can do for the economy may be winning a second term, with a mandate to advance his ideas on deficit reduction, entitlement changes..."So tell me why exactly I should want to re-elect a politician running on that platform? This is the democrat???
There will only be two material differences between Obama and whoever the GOP puts up:
1. What the GOPer will do sadistically, savagely, and with glee, Obama will do morosely and forelornly and regretfully because that's the only way to get a "bipartisan compromise" with the GOP.
2. Re-electing Obama guarantees a GOPer in 2016, whereas his losing means we might be able to elect a progressive in 2016.
Credit-Anstalt 2.NO: an overblown comparison
- by New Deal democrat
Within the last week there has been some discussion as to whether Europe is on the verge of a massive bank failure on the order of Austria's Credit-Anstalt in May 1931, with the implication that this could drag down major US banks as well, leading a repeat of the 2008-09 panic. The meme appears to have been started a week ago by an article in the UK's Daily Mail that said:
Within the last week there has been some discussion as to whether Europe is on the verge of a massive bank failure on the order of Austria's Credit-Anstalt in May 1931, with the implication that this could drag down major US banks as well, leading a repeat of the 2008-09 panic. The meme appears to have been started a week ago by an article in the UK's Daily Mail that said:
The Depression became global in 1931 when the French, fearing that the Germans were planning to expand their ever closer union with Austria, pulled their funds out of the Austrian Credit-Anstalt, which started a run on that bank in the May. Governor Montagu Norman of the Bank of England extended a 50million Austrian Schilling line of credit, rolled over weekly until the August when the bank had to call it in.The meme was amplified in this note by Global Macro Advisors, which has been republished in numerous places, including Barry Ritholtz' Big Picture, in which the authors say:
Suddenly it was clear that the Bank of England could no longer be the lender of last resort, and with no one else willing, the gold standard system began to crack up. In revenge, the French had started to convert their Sterling deposits to gold at a rate that exceeded the capacity to ship the stuff to Paris. Over the summer, the pressure on Sterling mounted and the Coalition (National) government proposed severe measures.
In September, ... Britain went off the gold standard.
Options are rapidly running out for Europe’s ailing mid-tier banks as nervous creditors pull the plug on once vital sources of funding in response to growing sovereign contagion worries, sowing the seeds of an imminent liquidity crisis at the heart of the eurozone.Let me say right off the bat that I have no specialized knowledge of European banking, and what their exposures to various of the PIIGS (now including, apparently, every European country except Germany), nor what arrangements might exist between US banks and any particularly affected European bank (if any).
With bond markets shut and investors unwilling to buy asset-backed securities, the repo market – for some banks the sole remaining source of private funding – has become the most recent tap to run dry, with some investment banks pulling credit lines worth tens of billions of euros in recent weeks.
Bankers who once ran the now-defunct repo facilities for mid-sized European banks say the credit lines were withdrawn after risk managers became concerned about their own exposure to the enfolding sovereign debt crisis, leaving some clients now solely reliant on central banks for cash.
But what I do have a good knowledge of, and where I take exception to the meme, is its comparison with the Great Depression. For example, I've written lengthy posts in the past about The 1920's Credit Bubble, discussing how in the 1920s there were nearly simultaneous bubbles in real estate (that began to burst in 1926), the stock market, and consumer installment credit. In researching this note, I came across this article pointing out that the 1920s real estate bubble also featured fraudulent appraisals and companies that insured mortgages without any standards whatsoever! (Those who do not remember their history etc....). I wrote a follow up piece about 1930 showing that as the recession deepened, it was the oversized halt in consumer spending (due to draconian appliance contracts that forfeited all equity if even one payment was missed) that was the biggest single cause of the economy diving into a deepening deflationary spiral.
The Global Macro Advisors piece rests on a quote from Ben Bernanke to the Council of Foreign Relations in 2009, in which he said:
Note first of all that Bernanke isn't saying that banks' insolvencies made the Depression what it was. Rather, it was the failure of the Fed (and other central bankers) to rescue them or their depositors, and simply allowing them to fail, that caused another ratcheting down of the vicious spiral. Secondly, note that the important spate of bank failures began in late 1930, months before the Credit-Anstalt went under.
In particular, it was the failure of New York City's Bank of the United States that, according to Milton Friedman's famous study of US monetary history, was the watershed moment in the US. Friedman believed that, had the Fed intervened to stop that bank's going under, the Depression might have bottomed then, instead of continuing to worsen for another two-plus years.
During the 1929-33 period, almost 40% of all commercial banks failed in the US. There were 1350 in 1930, 2293 in 1031, 1453 in 1932, and about 4000 in 1933. Of the 1350 failures in 1930, over 600 were in the two months of November and December. When the Bank of the United States failed in December 1930, it was the biggest bank failure to date, the largest since the Panic of 1907. and it was located right in New York City. That failure has been called "one of a series of deflationary shocks which combined to turn what might have been another painful but brief depression (comparable to 1920-21) into a catastrophe."
Indeed, an examination of those bank failures indicates that most of them had nothing whatsoever to do with ties to Europe. If anything, the failures were especially concentrated in farm areas and midwestern and southern cities, where an already depressed farm economy of the 1920s met with further catastrophe in the Great Plains' dust bowl:
Turning to the current situation, the Global Macro Advisors piece contains information that appears to contradict its main point: if credit lines from other sources have been withdrawn, if other banks and money market funds have already taken steps to minimize their exposure to a European "event," then it is much more difficult for the situation to metasticise to them. That appears to be the message from the still sleepy LIBOR and TED spread rates, and even now the EURIBOR rate is nowhere near where it was in 2008.
Certainly a renewed decline in Europe would adversely affect the US. But the 1931 Credit-Anstalt failure does not support any theory of financial contagion here.
The Global Macro Advisors piece rests on a quote from Ben Bernanke to the Council of Foreign Relations in 2009, in which he said:
[W]hen the financial system breaks down, becomes highly unstable, then that has very severe adverse effects on the economy.(my emphasis)
Once again, this is something that was not handled. The Federal Reserve did not intervene to stop the failure of about a third of all the banks in the United States. Globally, there were massive bank failures. I think perhaps the most critical, in May of 1931, the Creditanstalt, which was one of the largest banks in Europe, failed, which generated a wave of financial crisis around the world. Up till early 1931, arguably the 1929 downturn was just a ordinary -- severe but ordinary downturn. It was the financial crises and the collapse of banks and other institutions in late 1930 and early 1931 that made the Great Depression great.
Note first of all that Bernanke isn't saying that banks' insolvencies made the Depression what it was. Rather, it was the failure of the Fed (and other central bankers) to rescue them or their depositors, and simply allowing them to fail, that caused another ratcheting down of the vicious spiral. Secondly, note that the important spate of bank failures began in late 1930, months before the Credit-Anstalt went under.
In particular, it was the failure of New York City's Bank of the United States that, according to Milton Friedman's famous study of US monetary history, was the watershed moment in the US. Friedman believed that, had the Fed intervened to stop that bank's going under, the Depression might have bottomed then, instead of continuing to worsen for another two-plus years.
During the 1929-33 period, almost 40% of all commercial banks failed in the US. There were 1350 in 1930, 2293 in 1031, 1453 in 1932, and about 4000 in 1933. Of the 1350 failures in 1930, over 600 were in the two months of November and December. When the Bank of the United States failed in December 1930, it was the biggest bank failure to date, the largest since the Panic of 1907. and it was located right in New York City. That failure has been called "one of a series of deflationary shocks which combined to turn what might have been another painful but brief depression (comparable to 1920-21) into a catastrophe."
Indeed, an examination of those bank failures indicates that most of them had nothing whatsoever to do with ties to Europe. If anything, the failures were especially concentrated in farm areas and midwestern and southern cities, where an already depressed farm economy of the 1920s met with further catastrophe in the Great Plains' dust bowl:
During the banking panics of 1930 and 1931 there was no uniform response across the twelve Federal Reserve Districts .... These three (one in 1930 and two in 1931) banking panics were region specific inasmuch as at least one-half of the Districts had either fewer than 10 percent of the bank closings (1930) or there was little or no change in hoarding (April-August 1931).As you can see, the failure of the Credit-Anstalt had no significant direct impact on the banking situation in the United States, contrary to the meme that has been gaining traction in the last week. It did have an effect, but it was indirect, and it is a result of the fact stated in the last line of the Daily Mail article: the UK went off the gold standard. When that happened, the effects of the Great Depression began to abate in Great Britain - which had one of the mildest experiences in the industrialized world. But with the UK's currency debased, the US dollar appreciated -- amplifying the deflation in the US as American goods and services became more and more uncompetitive. When FDR went off the gold standard as well, and took emergency steps to insure bank deposits at the outset of his Administration in spring 1933, the spell was broken.
Two out of every five closings during the 1930 panic were located in the St. Louis Federal Reserve District. Four Districts accounted for 80 percent of total bank suspensions, and slightly over one-half of the deposits of failed banks. Between April and August 1931, one-third of the bank suspensions were in the Chicago District. There was a mini panic in Chicago in June and a full-scale panic in Toledo in August. The Cleveland Federal Reserve District had two-thirds of the deposits of suspended banks. However, in six Districts there was little or no change in currency hoarding.
During the September-October crisis in 1931 three Districts, Chicago, Cleveland and Philadelphia accounted for two-thirds of the deposits of suspended banks and one-half of the increase in hoarding. Moreover, there was a high concentration of suspensions in three cities: Pittsburgh, Philadelphia, and Chicago.
Turning to the current situation, the Global Macro Advisors piece contains information that appears to contradict its main point: if credit lines from other sources have been withdrawn, if other banks and money market funds have already taken steps to minimize their exposure to a European "event," then it is much more difficult for the situation to metasticise to them. That appears to be the message from the still sleepy LIBOR and TED spread rates, and even now the EURIBOR rate is nowhere near where it was in 2008.
Certainly a renewed decline in Europe would adversely affect the US. But the 1931 Credit-Anstalt failure does not support any theory of financial contagion here.
Saturday, August 13, 2011
Watch Consumer Spending
- by New Deal democrat
With consumer confidence plummeting, several bloggers have pointed out that such a plunge usually coincides with a recession. That's true, but the latest plunge can be traced directly back to the shameful display in Washington during the debt ceiling debate much moreso than direct economic data. S&P was far from alone in concluding that the outcome demonstrated and entrenched the empowerment of a veto-wielding minority of economic lunatics.
But consumer confidence is only one metric that signals an oncoming contraction. Simply put, you must watch consumer deeds at least as much their stated intentions.
Prof. James Hamilton has highlighted how consumer over-reactions to Oil price shocks bring on recessions:
Several years ago I wrote about how critical the severe consumer spending retrenchment was, in the wake of the 1929 stock market crash, in 1930. There I documented how:
A similar dynamic played out in September 2008. In response to a daily diet of cataclysm, consumers simply froze.
The bottom line is, it is the reaction - even over-reaction to events - by consumers in their spending that proclaims the downturn. And so far, that hasn't happened.
Let's start with the graph of consumer confidence as measured by the University of Michigan, showing its cliff-dive in the last two months (h/t Briefing.com:
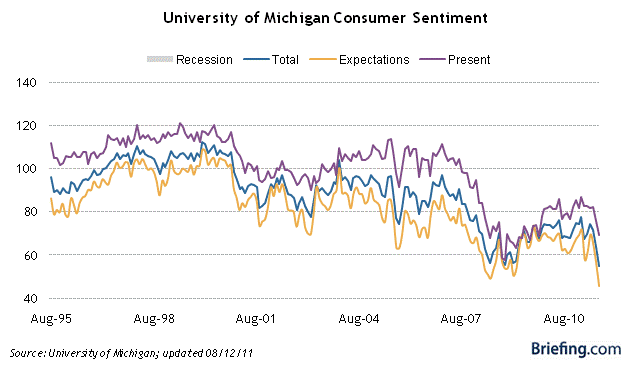
The sentiment bar (gold) is one of the 10 LEI, and will have a significant negative impact of the July report, along with the negative stock market.
But now let's pair that with consumer spending as measured by real retail sales (Note: since July inflation hasn't been reported, retail sales data (red) ends with June. By agreement with the U. of Michigan, the Fred graph only shows consumer confidence (blue) through last December):
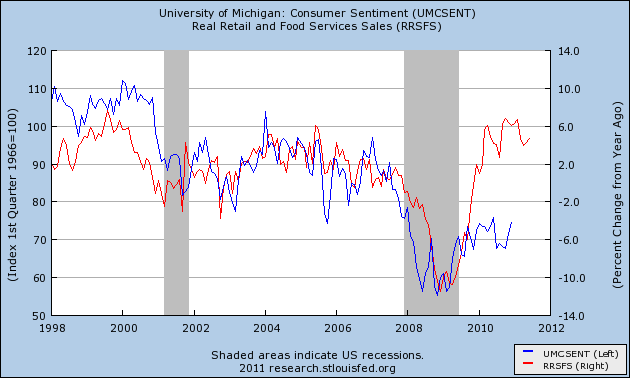
While consumer confidence has tanked (see first graph), spending is still going strong.
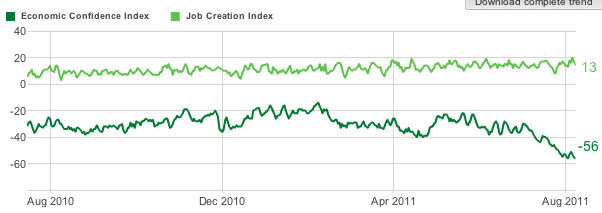
Even more up-to-date graphs can be found at Gallup. First of all, here is their poll of consumer sentiment through Friday August 11, showing the same precipitous decline as in the U. of Michigan data:
But now here is the consumer spending data from the very same Gallup poll:
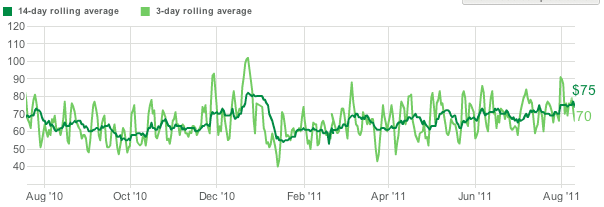
Notice that consumer spending is at its highest peak in over a year. Only last Christmas was higher, and this August is significantly ahead of last August. (As an interesting aside, Gallup consumer spending was cited once by the Pied Piper of Doom: heralding that "consumer spending [has] collapsed" on January 16, 2011. This was smack in the middle of the three worst days period of the last 2 years. Yes, he unintentionally bottom-ticked it! For some reason he hasn't mentioned it since ....)
In short, if consumers feel no confidence in their government to do the right thing for the economy, it isn't showing up in their wallets yet. Unless and until it shows up in their wallets, it is unlikely that a contraction has started.
With consumer confidence plummeting, several bloggers have pointed out that such a plunge usually coincides with a recession. That's true, but the latest plunge can be traced directly back to the shameful display in Washington during the debt ceiling debate much moreso than direct economic data. S&P was far from alone in concluding that the outcome demonstrated and entrenched the empowerment of a veto-wielding minority of economic lunatics.
But consumer confidence is only one metric that signals an oncoming contraction. Simply put, you must watch consumer deeds at least as much their stated intentions.
Prof. James Hamilton has highlighted how consumer over-reactions to Oil price shocks bring on recessions:
[W]hen energy prices go up, consumer spending falls. But there are two surprising things about the quantitative character of this response. The first surprise is the delay-- energy prices go up at time t, but the biggest consequences for consumption spending aren't seen until [ ] 12 months later. The second surprising feature of these results is the magnitude. If consumers continued to purchase the same number of gallons of gasoline as they had before, a shock of the size analyzed in this graph would require them to reduce spending on other items by 1%. Yet eventually they historically would be predicted to reduce spending by 2.2%. ... [C]onsumers cut spending by [ ] much more than the shock itself."(my emphaisis)
Several years ago I wrote about how critical the severe consumer spending retrenchment was, in the wake of the 1929 stock market crash, in 1930. There I documented how:
What made matters worse was a big drop in U.S. consumer spending—far more than can be explained by the stock market crash. The drop may have been a backlash to the rise of installment lending (for cars, furniture, and appliances) in the twenties. The prevailing practice allowed lenders to repossess an item if the borrower missed just one payment. People may have stopped making new purchases to reduce the risk of losing things they already had bought on credit. Whatever happened, the slump soon fed on itself. Weak spending depressed prices, which meant that many farmers, businesses, and nations couldn't repay their debts. Rising bad debts prompted banks to restrict new loans and sell financial assets, usually bonds. Scarce credit led to less borrowing, less spending, lower prices, and more bankruptcies.
A similar dynamic played out in September 2008. In response to a daily diet of cataclysm, consumers simply froze.
The bottom line is, it is the reaction - even over-reaction to events - by consumers in their spending that proclaims the downturn. And so far, that hasn't happened.
Let's start with the graph of consumer confidence as measured by the University of Michigan, showing its cliff-dive in the last two months (h/t Briefing.com:
The sentiment bar (gold) is one of the 10 LEI, and will have a significant negative impact of the July report, along with the negative stock market.
But now let's pair that with consumer spending as measured by real retail sales (Note: since July inflation hasn't been reported, retail sales data (red) ends with June. By agreement with the U. of Michigan, the Fred graph only shows consumer confidence (blue) through last December):
While consumer confidence has tanked (see first graph), spending is still going strong.
Even more up-to-date graphs can be found at Gallup. First of all, here is their poll of consumer sentiment through Friday August 11, showing the same precipitous decline as in the U. of Michigan data:
But now here is the consumer spending data from the very same Gallup poll:
Notice that consumer spending is at its highest peak in over a year. Only last Christmas was higher, and this August is significantly ahead of last August. (As an interesting aside, Gallup consumer spending was cited once by the Pied Piper of Doom: heralding that "consumer spending [has] collapsed" on January 16, 2011. This was smack in the middle of the three worst days period of the last 2 years. Yes, he unintentionally bottom-ticked it! For some reason he hasn't mentioned it since ....)
In short, if consumers feel no confidence in their government to do the right thing for the economy, it isn't showing up in their wallets yet. Unless and until it shows up in their wallets, it is unlikely that a contraction has started.
Weekly Indicators show continued stabilization edition
- by New Deal democrat
There was little monthly data released this week, but there were two very big numbers - in opposite directions. The big positive was retail sales, up .5% in July. June was also revised up from .1% to .3%, and May was revised higher as well. Q2 productivity declined, so maybe firms could hire a few more workers instead? Consumer sentiment for the end of July, on the other hand, plunged to multi-decade lows, mirroring and almost certainly a direct result of the lunacy in Washington and the crashing stock market.
There was little monthly data released this week, but there were two very big numbers - in opposite directions. The big positive was retail sales, up .5% in July. June was also revised up from .1% to .3%, and May was revised higher as well. Q2 productivity declined, so maybe firms could hire a few more workers instead? Consumer sentiment for the end of July, on the other hand, plunged to multi-decade lows, mirroring and almost certainly a direct result of the lunacy in Washington and the crashing stock market.
For the third week in a row, however, the high frequency weekly indicators show a halt in the trend towards contraction.
First, let's look at the positive signs in order of their magnitude:
Money supply -a leading indicator - has been surging lately. M1 increased 1.1% w/w, and also increased 1.6% m/m, and 14.7% YoY, so Real M1 was up 11.3%. M2 increased 0.2% w/w, and also increased 2.0% m/m, and 7.9% YoY, so Real M2 was up 4.5%. Comparing the entire month of July m/m and YoY, M1 was up 2.5% m/m and 10.6% YoY, so Real M1 was up 7.2%. M2 was up 2.2% m/m and 7.6% YoY, so Real M2 was up 4.2%. In short, both Real M1 and Real M2 are solidly bullish.
The Oil choke collar has loosened again, with the usual positive result. Oil finished at $85.37 a barrel on Friday. This is the lowest price since last November, and is nearly $10 below its recession-trigger level. Gas at the pump fell $.04 to $3.67 a gallon. For the first time in 7 weeks and for only the 4th time in 5 months, gasoline usage was higher than a year ago: up 0.1% at 9244 M gallons vs. 9236 a year ago.
Initial jobless claims - another leading indicator - have clearly reversed their April - June upturn and are solidly trending back downward. The BLS reported Initial jobless claims of 395,000. The four week average decreased to 405,000. Jobless claims have decisively broken to the downside from their recent range, and with the exception of 7 weeks in February - April of this year, are lower than they have been in 3 years.
Despite nearly universal opinion "knowing" to the contrary, Housing - a third, and major, leading indicator - continues to trend positive. As to sales, the Mortgage Bankers' Association reported that seasonally adjusted mortgage applications decreased 0.9% last week. For the 10th time in 11 weeks, however, the YoY comparison in purchase mortgages was positive, up 4.9% YoY. Refinancing also increased 30.4% w/w due to cliff-diving interest rates.
As to housing prices, YoY weekly median asking house prices from 54 metropolitan areas at Housing Tracker showed that the asking prices declined -2.9% YoY. This is the smallest YoY decline since May 2007. The areas with double-digit YoY% declines decreased by one more to 6. The areas with YoY% increases in price increased by one more to 11. This again continues the record of improving YoY comparisons in this series. Just a couple of months ago only 3 or 4 areas had actual increases, and well over 10 had decreases. At the beginning of this year, only one metro area was showing YoY increases.
Retail same store sales continue to perform well. The ICSC reported that same store sales for the week of July 30 increased 4.0% YoY, and increased 0.3% week over week. Shoppertrak reported a 4.1% YoY increase for the week ending July 30 and a WoW increase of 0.5%. This is the sixth week in a row of a strong rebound for the ICSC, joined for the third week by Shoppertrak.
None of the four remaining series are negative, although they are just above a stall. Only one subindex was negative.
The American Staffing Association Index for the third week in a row is at 88. This trend of this series for the year is worse than 2007, and is now equivalent to the first half of the recession year of 2008 - and just slightly better than a complete stall.
Weekly BAA commercial bond rates decreased .34% to 5.38%. Yields on 10 year treasury bonds fell a nearly identical .35% to 2.62%. This indicates a significant increase in the fear of deflationary, but no relative distress in the corporate market. If the market feared rising corporate defaults, this spread should be widening.
Adjusting +1.07% due to the 2011 tax compromise, the Daily Treasury Statement showed that for the first 8 days of August 2011, $59.3 B was collected vs. $58.7 B a year ago, for an increase of $0.6 B. For the last 20 days, $129.0 B was collected vs. $126.7 B a year ago, for an increase of $2.3 B, or 1.8%. Collections faded this week from their strong July rebound, but are still positive.
The American Association of Railroads reported that total carloads increased 0.3% YoY, up 1500 carloads to 533,300 YoY for the week ending August 6. Intermodal traffic (a proxy for imports and exports) was up 4400 carloads, or 1.9% YoY. The remaining baseline plus cyclical traffic was up 1100 carloads, or 0.4% YoY%. This series returned to gains after 2 of the last 5 weeks were negative. Railfax graciously gave me their breakdown of baseline vs. cyclical carloads, which shows that baseline traffic was down 3700 carloads, or -2.0%YoY, while cyclical traffic was up 4700 carloads, or +4.6% YoY.
In summary, the last three weeks of high frequency data have suggested an end to the March - July declining trend into contraction in the data sets, chiefly Oil prices and gasoline usage, but also rail traffic and initial jobless claims. Additionally, BAA bonds in comparison with treasuries have gone from negative to neutral. Real M2 has improved, as have same store sales, and housing prices continue to move towards stabilization. Real M1, retail sales, and purchase mortgage applications remain solidly positive. Temporary staffing and rail traffic in particular continue to be areas of concern, and whether there has been any important positive trend break in gasoline usage will be watched closely.
First, let's look at the positive signs in order of their magnitude:
Money supply -a leading indicator - has been surging lately. M1 increased 1.1% w/w, and also increased 1.6% m/m, and 14.7% YoY, so Real M1 was up 11.3%. M2 increased 0.2% w/w, and also increased 2.0% m/m, and 7.9% YoY, so Real M2 was up 4.5%. Comparing the entire month of July m/m and YoY, M1 was up 2.5% m/m and 10.6% YoY, so Real M1 was up 7.2%. M2 was up 2.2% m/m and 7.6% YoY, so Real M2 was up 4.2%. In short, both Real M1 and Real M2 are solidly bullish.
The Oil choke collar has loosened again, with the usual positive result. Oil finished at $85.37 a barrel on Friday. This is the lowest price since last November, and is nearly $10 below its recession-trigger level. Gas at the pump fell $.04 to $3.67 a gallon. For the first time in 7 weeks and for only the 4th time in 5 months, gasoline usage was higher than a year ago: up 0.1% at 9244 M gallons vs. 9236 a year ago.
Initial jobless claims - another leading indicator - have clearly reversed their April - June upturn and are solidly trending back downward. The BLS reported Initial jobless claims of 395,000. The four week average decreased to 405,000. Jobless claims have decisively broken to the downside from their recent range, and with the exception of 7 weeks in February - April of this year, are lower than they have been in 3 years.
Despite nearly universal opinion "knowing" to the contrary, Housing - a third, and major, leading indicator - continues to trend positive. As to sales, the Mortgage Bankers' Association reported that seasonally adjusted mortgage applications decreased 0.9% last week. For the 10th time in 11 weeks, however, the YoY comparison in purchase mortgages was positive, up 4.9% YoY. Refinancing also increased 30.4% w/w due to cliff-diving interest rates.
As to housing prices, YoY weekly median asking house prices from 54 metropolitan areas at Housing Tracker showed that the asking prices declined -2.9% YoY. This is the smallest YoY decline since May 2007. The areas with double-digit YoY% declines decreased by one more to 6. The areas with YoY% increases in price increased by one more to 11. This again continues the record of improving YoY comparisons in this series. Just a couple of months ago only 3 or 4 areas had actual increases, and well over 10 had decreases. At the beginning of this year, only one metro area was showing YoY increases.
Retail same store sales continue to perform well. The ICSC reported that same store sales for the week of July 30 increased 4.0% YoY, and increased 0.3% week over week. Shoppertrak reported a 4.1% YoY increase for the week ending July 30 and a WoW increase of 0.5%. This is the sixth week in a row of a strong rebound for the ICSC, joined for the third week by Shoppertrak.
None of the four remaining series are negative, although they are just above a stall. Only one subindex was negative.
The American Staffing Association Index for the third week in a row is at 88. This trend of this series for the year is worse than 2007, and is now equivalent to the first half of the recession year of 2008 - and just slightly better than a complete stall.
Weekly BAA commercial bond rates decreased .34% to 5.38%. Yields on 10 year treasury bonds fell a nearly identical .35% to 2.62%. This indicates a significant increase in the fear of deflationary, but no relative distress in the corporate market. If the market feared rising corporate defaults, this spread should be widening.
Adjusting +1.07% due to the 2011 tax compromise, the Daily Treasury Statement showed that for the first 8 days of August 2011, $59.3 B was collected vs. $58.7 B a year ago, for an increase of $0.6 B. For the last 20 days, $129.0 B was collected vs. $126.7 B a year ago, for an increase of $2.3 B, or 1.8%. Collections faded this week from their strong July rebound, but are still positive.
The American Association of Railroads reported that total carloads increased 0.3% YoY, up 1500 carloads to 533,300 YoY for the week ending August 6. Intermodal traffic (a proxy for imports and exports) was up 4400 carloads, or 1.9% YoY. The remaining baseline plus cyclical traffic was up 1100 carloads, or 0.4% YoY%. This series returned to gains after 2 of the last 5 weeks were negative. Railfax graciously gave me their breakdown of baseline vs. cyclical carloads, which shows that baseline traffic was down 3700 carloads, or -2.0%YoY, while cyclical traffic was up 4700 carloads, or +4.6% YoY.
In summary, the last three weeks of high frequency data have suggested an end to the March - July declining trend into contraction in the data sets, chiefly Oil prices and gasoline usage, but also rail traffic and initial jobless claims. Additionally, BAA bonds in comparison with treasuries have gone from negative to neutral. Real M2 has improved, as have same store sales, and housing prices continue to move towards stabilization. Real M1, retail sales, and purchase mortgage applications remain solidly positive. Temporary staffing and rail traffic in particular continue to be areas of concern, and whether there has been any important positive trend break in gasoline usage will be watched closely.
Have a nice weekend!
Friday, August 12, 2011
SPYs Looking Like A Bottom

The above chart is a 10-day, 5-minute chart of the SPYs. Notice that from Monday through Thursday we have a rounding bottom. Now we're waiting to see if we have a handle for a cup and saucer formation.
The key level the market needs to break through is 119.
If A Recession Comes, Blame Washington
Earlier this year, NDD noted that Washington was a big negative wild card for the economy. Not being that politically astute I read over that statement, frankly not really knowing what to think. However, his statements to that effect now show a prescient reading of the landscape; Washington is indeed a huge problem and their current policy choices indicate they are as much the problem -- if not the primary problem -- in the current environment.
At the beginning of the year, the general economic consensus was for growth to start picking up. However, the EU crisis and the Japanese earthquake hammered growth in ways not anticipated. This was evidenced by the large downward revision to the first two quarters of 2011 growth, which printed two sub 2% quarters. This is a very discouraging sign.
Now, we have Washington focused on the need for "deficit reduction." Yet their solution -- which is disproportionately focused on cutting spending instead of a balanced approach between raising revenue and cutting spending -- is occurring at exactly the wrong time. This is born out by recent market events. Consider this chart:

The debt deal was signed on August 2. Since then, the stock market has tanked hard. Notice the massive volume on the sell-off and the incredibly strong downward sloping bars. Where is the euphoria? Where is the, "they got it right, the economy will now grow at strong rates so we should start buying shares" rally? Nowhere. In other words, the deal accomplished just the opposite of what the market wanted.
"But Bonddad! The economy is heading towards a double dip recession! We're doomed" As I've shown, there is little possibility of a double dip without recent events because there isn't much lower the economy can go. It's hard to see the economy dropping without a commensurate drop in housing. Yet housing is already bouncing along a bottom. And from an employment standpoint, it's hard to see how companies could cut any more employment fat from their budgets. The recent initial unemployment claims reading shows that companies are nowhere near the record lay-offs that occurred during the recession. Gas prices have dropped sharply, which is a boon to consumers. And consumer spending is moving sideways, not crashing. In short, the underlying data point to a 0%-2% GDP growth situation.
The problem with the debt deal is it took government action off the table at a time when governmental action is needed. Instead of borrowing at insanely low rates, investing massively in a degrading US physical and intellectual infrastructure, Congress is taking action off the table. Remember that governmental spending is a component in the GDP equation -- a fact lost in Washington policy debates, as is the different between consumption and investment. In short, Washington is focused on exactly the wrong thing at exactly the wrong time and as such should bear the brunt of any economic slowdown we face.
At the beginning of the year, the general economic consensus was for growth to start picking up. However, the EU crisis and the Japanese earthquake hammered growth in ways not anticipated. This was evidenced by the large downward revision to the first two quarters of 2011 growth, which printed two sub 2% quarters. This is a very discouraging sign.
Now, we have Washington focused on the need for "deficit reduction." Yet their solution -- which is disproportionately focused on cutting spending instead of a balanced approach between raising revenue and cutting spending -- is occurring at exactly the wrong time. This is born out by recent market events. Consider this chart:

The debt deal was signed on August 2. Since then, the stock market has tanked hard. Notice the massive volume on the sell-off and the incredibly strong downward sloping bars. Where is the euphoria? Where is the, "they got it right, the economy will now grow at strong rates so we should start buying shares" rally? Nowhere. In other words, the deal accomplished just the opposite of what the market wanted.
"But Bonddad! The economy is heading towards a double dip recession! We're doomed" As I've shown, there is little possibility of a double dip without recent events because there isn't much lower the economy can go. It's hard to see the economy dropping without a commensurate drop in housing. Yet housing is already bouncing along a bottom. And from an employment standpoint, it's hard to see how companies could cut any more employment fat from their budgets. The recent initial unemployment claims reading shows that companies are nowhere near the record lay-offs that occurred during the recession. Gas prices have dropped sharply, which is a boon to consumers. And consumer spending is moving sideways, not crashing. In short, the underlying data point to a 0%-2% GDP growth situation.
The problem with the debt deal is it took government action off the table at a time when governmental action is needed. Instead of borrowing at insanely low rates, investing massively in a degrading US physical and intellectual infrastructure, Congress is taking action off the table. Remember that governmental spending is a component in the GDP equation -- a fact lost in Washington policy debates, as is the different between consumption and investment. In short, Washington is focused on exactly the wrong thing at exactly the wrong time and as such should bear the brunt of any economic slowdown we face.
Thursday, August 11, 2011
Friday Dollar Analysis
Last week I didn't write on the dollar, instead focusing on the turmoil in the market. Since the last time I wrote about the dollar we've had two dollar negative developments. The first was the 2nd quarter GDP report, which printed a very weak number. Secondly, the Federal Reserve announced they would leave interest rates low until 2013. Both of these events should have been dollar negative. The weak GDP report would lead investors to look for higher growing economies while the Fed's announcement would mean the interest rate return for investment parked in dollars would be little to none. However, the dollar instead continues to move sideways:

The dollar ETF is trading in a roughly 80 cent range, between 20.90 and 21.7 and has been for several months. The volume indicators have a slight negative bias, but nothing strong enough to indicate mass selling. The MACD shows little to no direction at all.
What's interesting about the last two weeks events is they should have sent the dollar tumbling. A weak GDP report indicates there is little reason to park dollars in the US; the Fed decision indicates there is no interest rate incentive to buy dollars. And the S&P downgrade correctly pointed out that the US political system is a wreck more interested in partisanship than solving problems. Yet, the dollar didn't crash, instead continuing to form a solid base. The dollar is -- at least, so far -- the least ugly of several options. However, keep a strong eye on the 20.9 area; a move through that would be a problem.

The dollar ETF is trading in a roughly 80 cent range, between 20.90 and 21.7 and has been for several months. The volume indicators have a slight negative bias, but nothing strong enough to indicate mass selling. The MACD shows little to no direction at all.
What's interesting about the last two weeks events is they should have sent the dollar tumbling. A weak GDP report indicates there is little reason to park dollars in the US; the Fed decision indicates there is no interest rate incentive to buy dollars. And the S&P downgrade correctly pointed out that the US political system is a wreck more interested in partisanship than solving problems. Yet, the dollar didn't crash, instead continuing to form a solid base. The dollar is -- at least, so far -- the least ugly of several options. However, keep a strong eye on the 20.9 area; a move through that would be a problem.
A Quick Look At The Treasury Market
Earlier today I looked at the stock market. Let's look at the other, more conservative side of the investment coin -- the bond market.

The 10-day, 5-minute chart is still rallying. However, prices are just about to move through a shorter term (3 1/2 day) trend line. In addition, prices have been consolidating in a fairly tight range over the last day or so. Also note the higher volume level over the last three 3 1/2 days (follow the blue line). This might indicate a buying climax.

The daily chart and its respective indicators are very bullish. All the EMAs are moving higher with the shorter above the longer. The A/D and CMF both indicate money is still flowing into the market and the MACD is still very positive, telling us the market's momentum is still strong. However, notice the candles are a bit above the EMAs, indicating the market may be slightly over-extended at this point. A pullback to the 10 day EMA would make tremendous sense, especially as people start to take some profit off the table.
However, there is still no indicator of a sell-off developing.

The 10-day, 5-minute chart is still rallying. However, prices are just about to move through a shorter term (3 1/2 day) trend line. In addition, prices have been consolidating in a fairly tight range over the last day or so. Also note the higher volume level over the last three 3 1/2 days (follow the blue line). This might indicate a buying climax.
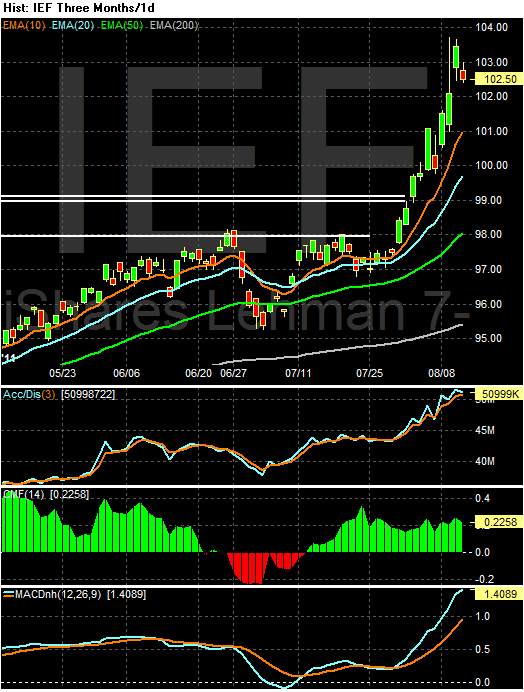
The daily chart and its respective indicators are very bullish. All the EMAs are moving higher with the shorter above the longer. The A/D and CMF both indicate money is still flowing into the market and the MACD is still very positive, telling us the market's momentum is still strong. However, notice the candles are a bit above the EMAs, indicating the market may be slightly over-extended at this point. A pullback to the 10 day EMA would make tremendous sense, especially as people start to take some profit off the table.
However, there is still no indicator of a sell-off developing.
Large cap stock dividends look compelling
- by New Deal democrat
I've had drafts of several lengthy pieces prepared discussing the fundamentals of the US economy, but instead of those long posts, let me just say instead that whatever has been driving the stock market crash of the last two weeks, it isn't US domestic economic data, because with the exception of the Oil choke collar I've been writing about, the only other series to actually turn down recently are consumer confidence and the new orders component of the ISM manufacturing report. Every other data series is either continuing to improve or is going sideways - and that includes the majority of the Leading Indicators. For example, this morning's initial claims number of 395,000 is - with the exception of 8 weeks earlier this year - the best in the last 4+ years.
In other words, the cliff-diving of the stock market has been a solo performance.
So let me turn to a by-product of that cliff-diving. Suppose you had $10,000 that you had saved and were sure you wouldn't need for ahwile. Where would you put it?
You could put it in a bank. What sort of rate of return would you get? According to Bankrate, here is the best return you could get on various CD terms:
3 month 0.81%
1 year 1.27%
5 year 2.40%
Or you could invest in government bonds. According to the US Treasury, here is the interest you would make:
1 month 0.02%
1 year 0.09%
5 year 0.93%
10 year 2.17%
With inflation currently running over 3%, unless you think we are going to be in outright deflation or very close thereto for the next few years, both savings CDs and treasuries amount to "Certificates of Confiscation" as they used to say in the 1970s.
Now, let me show you the dividend yields on 17 of the 30 Dow Jones Industrial stocks as of yesterday:
AT&T 6.28%
Verizon 5.94%
Merck 5.10%
Pfizer 5.04%
Intel 4.37%
General Electric 4.24%
Johnson & Johnson 3.87%
Procter & Gamble 3.74%
Dupont 3.66%
Home Depot 3.65%
Kraft Foods 3.54%
Chevron 3.51%
Wal Mart 3.36%
McDonalds 3.15%
Coca-Cola 3.03%
Microsoft 3.02%
Boeing 3.00%
As of last Friday, the DJ yield gap - the comparison of yields between best quality bonds and stock dividends - had fallen to a nearly unprecedented 1.76%. Unless you think we are facing economic Armageddon - that could result in dividend cuts as well as plunging share prices - in other words, that people will stop using computers and electronics, not buy consumer products or appliances, and not use gas, or else high inflation is right around the corner - these are compelling values. You are getting paid a rate higher than any relatively safe bond investment, and higher than the rate of inflation for most of the last decade, simply to own a small slice of some of the biggest and most stable companies on the planet.
And they're on sale at 20% off.
Even if you think the prices of these shares will continue to fall in the near future, you are getting paid a dividend over and above the rate of inflation while you wait for your capital investment to break even at some future date.
Let me emphasize that I am not offering investment advice here. Everyone must do their own due diligence. But as of Thursday morning, August 11, 2011, the risk/reward profile doesn't look even remotely symmetrical.
I've had drafts of several lengthy pieces prepared discussing the fundamentals of the US economy, but instead of those long posts, let me just say instead that whatever has been driving the stock market crash of the last two weeks, it isn't US domestic economic data, because with the exception of the Oil choke collar I've been writing about, the only other series to actually turn down recently are consumer confidence and the new orders component of the ISM manufacturing report. Every other data series is either continuing to improve or is going sideways - and that includes the majority of the Leading Indicators. For example, this morning's initial claims number of 395,000 is - with the exception of 8 weeks earlier this year - the best in the last 4+ years.
In other words, the cliff-diving of the stock market has been a solo performance.
So let me turn to a by-product of that cliff-diving. Suppose you had $10,000 that you had saved and were sure you wouldn't need for ahwile. Where would you put it?
You could put it in a bank. What sort of rate of return would you get? According to Bankrate, here is the best return you could get on various CD terms:
3 month 0.81%
1 year 1.27%
5 year 2.40%
Or you could invest in government bonds. According to the US Treasury, here is the interest you would make:
1 month 0.02%
1 year 0.09%
5 year 0.93%
10 year 2.17%
With inflation currently running over 3%, unless you think we are going to be in outright deflation or very close thereto for the next few years, both savings CDs and treasuries amount to "Certificates of Confiscation" as they used to say in the 1970s.
Now, let me show you the dividend yields on 17 of the 30 Dow Jones Industrial stocks as of yesterday:
AT&T 6.28%
Verizon 5.94%
Merck 5.10%
Pfizer 5.04%
Intel 4.37%
General Electric 4.24%
Johnson & Johnson 3.87%
Procter & Gamble 3.74%
Dupont 3.66%
Home Depot 3.65%
Kraft Foods 3.54%
Chevron 3.51%
Wal Mart 3.36%
McDonalds 3.15%
Coca-Cola 3.03%
Microsoft 3.02%
Boeing 3.00%
As of last Friday, the DJ yield gap - the comparison of yields between best quality bonds and stock dividends - had fallen to a nearly unprecedented 1.76%. Unless you think we are facing economic Armageddon - that could result in dividend cuts as well as plunging share prices - in other words, that people will stop using computers and electronics, not buy consumer products or appliances, and not use gas, or else high inflation is right around the corner - these are compelling values. You are getting paid a rate higher than any relatively safe bond investment, and higher than the rate of inflation for most of the last decade, simply to own a small slice of some of the biggest and most stable companies on the planet.
And they're on sale at 20% off.
Even if you think the prices of these shares will continue to fall in the near future, you are getting paid a dividend over and above the rate of inflation while you wait for your capital investment to break even at some future date.
Let me emphasize that I am not offering investment advice here. Everyone must do their own due diligence. But as of Thursday morning, August 11, 2011, the risk/reward profile doesn't look even remotely symmetrical.
A Look at Technical Support Levels for the SPYs

The above chart is a weekly chart of the SPYs with two sets of Fibinacci levels. But use the early 2009 lows but one top is from late 2007 and the other is from mid-2011. I've also drawn a tight rectangle from price levels established earlier this year.
The point of the above chart is we are right in an area where various models would place important trading levels for various reasons. That doesn't mean we will, mind you, but the possibility is there.
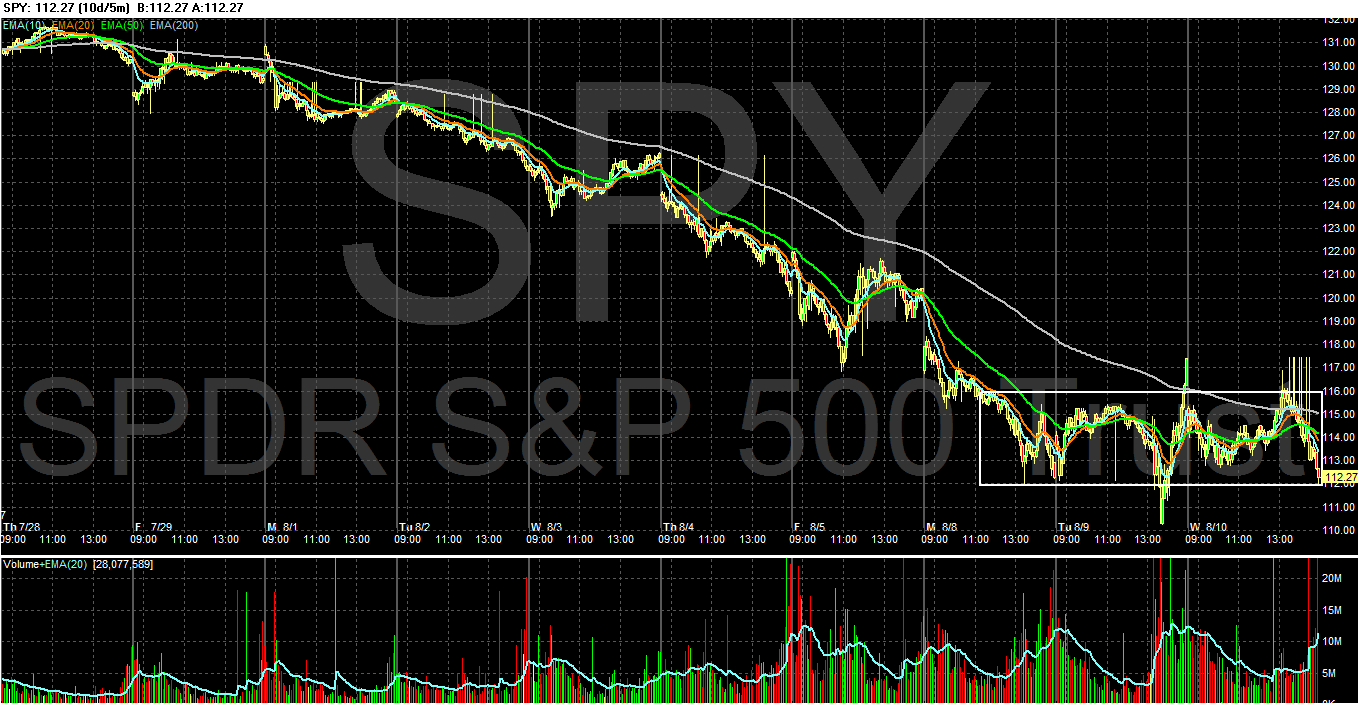
Notice on the 10-day, 5-minute chart that prices are moving sideways for the last two and a half days. Again, that doesn't mean we'll stay here, but it does look like the market is looking for a bottom at these levels.
Thursday Oil Market Analysis
Last week, I wrote the following about the oil market:

On the 1-year chart, we see that prices were this low nearly 1-year ago.

The 6-month chart shows the latest downward move in more detail. After moving higher, prices first dropped lower at the beginning of May when them moved down sharply and found support near the 200 day EMA. Prices next moved sideways using the 200 day EMA as technical support, but then moved lower again in mid-June. Prices dropped then rallied again until mid-July when they just barely got through the EMAs. Now prices have dropped lower again, this time very sharply. Also note the shorter EMAs are all now moving lower and have moved through the 200 day EMA. Momentum is clearly negative as well.

On the 5-day chart, we see a rising wedge pattern; prices are moving higher but have hit upside resistance in the 85/85 price area.
The oil market is now near a 1-year low, indicating the fears of a slowing economy and the commensurate drop in demand are driving trading decisions. While the long-term supply/demand imbalance is still very bullish (which I have thought would dominate trading decisions over the last month and a half or so), the short term trading environment is clearly bearish. Right now prices are looking for a bottom on which to create a base.
The next key level of support is 90/bbl. Should prices move lower, we'll have to go back on the chart to fine support and resistance.The market has done just that -- moved lower. So let's take a look at the 1-year chart to see where support and resistance are:

On the 1-year chart, we see that prices were this low nearly 1-year ago.

The 6-month chart shows the latest downward move in more detail. After moving higher, prices first dropped lower at the beginning of May when them moved down sharply and found support near the 200 day EMA. Prices next moved sideways using the 200 day EMA as technical support, but then moved lower again in mid-June. Prices dropped then rallied again until mid-July when they just barely got through the EMAs. Now prices have dropped lower again, this time very sharply. Also note the shorter EMAs are all now moving lower and have moved through the 200 day EMA. Momentum is clearly negative as well.

On the 5-day chart, we see a rising wedge pattern; prices are moving higher but have hit upside resistance in the 85/85 price area.
The oil market is now near a 1-year low, indicating the fears of a slowing economy and the commensurate drop in demand are driving trading decisions. While the long-term supply/demand imbalance is still very bullish (which I have thought would dominate trading decisions over the last month and a half or so), the short term trading environment is clearly bearish. Right now prices are looking for a bottom on which to create a base.
Wednesday, August 10, 2011
How China's Economy Works
From the WSJ:
Can China rebalance away from investment and toward domestic consumption as the main engine of growth? Yes, but with great difficulty. Chinese households consume only about 35% of gross domestic product (GDP), far less than any other country. Such a large domestic imbalance has no historical precedent.Some in Beijing understand how lopsided their development has been. So over the next 10 years, policy makers have said they will try to raise consumption to 50% of GDP. Even that is a low number; it would put China at the bottom of the group of low-consuming East Asian countries.
But achieving this goal is problematic, since it requires that household consumption grow four percentage points faster than GDP. In the past decade, Chinese household consumption has grown by 7% to 8% annually, while GDP has grown at 10% to 11%. If one expects Chinese GDP to grow by 6% to 7%, Chinese household consumption would have to surge by 10% to 11%.
Such consumption growth is unlikely because powerful structural factors work against it. The Chinese growth model transfers income from households to the corporate sector, mainly in the form of artificially low interest rates. These sharply reduce borrowing costs for the state-owned companies that funnel this easy money into mega-investments. The easy financing also gooses banks' profit margins and allows them to resolve bad loans with ease.
This cheap borrowing comes at the expense of depositors. Low yields on deposits force them to sacrifice consumption, to save more. This results in a sharp decline in consumption's share of GDP. If China is to replace investment with consumption as the engine of growth, this process of financial repression has to be reversed. Households must get a rising share of overall growth.
This reversal is inevitable, but it will not come easily. Wasted investment and excess capacity translate into growing amounts of bank debt, meaning continued wealth transfers are necessary to keep the banking system viable. But if households continue to pay over the next few years, as they have in the past, China will be stuck in the same model.
2.22% For Infrastructure Investments -- What A Wasted Opportunity
From the Financial Times:
“The US electrical grid has been plagued by ever more and ever worse blackouts over the past 15 years,’’ according to a report by Massoud Amin, director of the Technological Leadership Institute at the University of Minnesota – Twin Cities.The Texas grid operator instituted Thursday power cuts to big industrial customers and warned of potential rolling blackouts to others. It said all power sources were being tapped to meet record demand amid an unrelenting heatwave that knocked out power from 20 plants.
The crisis follows three months of record power demand amid 100 degree Fahrenheit temperatures. In February, the Electric Reliability Council of Texas was forced to institute rolling blackouts amid a winter freeze.
“The power grid continues to struggle to keep pace with growing demand.”
Many coal-fired plants date back to the 1940s. Dozens of nuclear reactors are 40 years old, with no new plants built in 30 years. Many of the country’s transmission lines were built 50 or more years ago, before the boom in personal computers and flatscreen televisions that has put a strain on the grid.
I live in Houston, Texas. This time of year we are hot -- as in 100+ degrees for most of August and early September. So heat is nothing new. Yet our power grid -- which we know will be hit by massive demand considering we're growing at a strong pace -- is of poor quality.
At the macro level, this is absolutely amazing. We are the largest economy in the world, and yet countries like China -- supposed "developing countries"-- engage in massive infrastructure projects that help to make their economy that much more competitive and capable of dealing with international competition. Here we, well, don't. And that's eventually going to shoot us in the foot big time.
In the last Texas state legislative session -- when we faced a massive deficit of over $25 billion -- there were no new tax increases. Instead we cut such unnecessary programs as education - which makes complete sense considering we already perform poorly in things such as graduation rate and have a school board that spent the better part of a year debating whether to include religious dogma in scientific text books.
It's situations like the above that make the current austerity debate in Washington so incredibly counter-productive and downright stupid. Right now, we could borrow at 2.22% for 10 years and rebuild our infrastructure. The rate of return in terms of growth far outweigh the costs. This would ultimately increase the denominator of the debt/GDP debt ratio calculation (I know -- math is a bit difficult for most people now). We could solve some of the basic problems faced in the jobs market. And yet, here we are doing the exact opposite. Thanks to the idiots in Washington, we're stuck with a crumbling infrastructure. As such, we're left with the following:
We now also understand that the US is not going to make meaningful investments in its economic future. The conservative position that all spending is evil obliterates any distinction between investment and consumption, between the long term and the short term. The US suffers with an increasingly third-world level of infrastructure, third-tier education system and enormous gaps in the preparedness of its workforce. The debate has now ended; money to upgrade those faltering systems will not be forthcoming. And by the way, the US is not going to take on any other major problems either – immigration, tax reform or climate change, for example. It is not going to do so for the same reason it has failed at sensible economic management: because the Tea Party has a veto.
Breaking: THE BOTTOM IS IN !!!
- by New Deal democrat
Both the King of All Doomers and the Pied Piper of Doom have triumphalist pieces up this morning.
If their past performance is any guide, this means that the bottom of the stock market correction was yesterday afternoon after the Fed announcement.
This has been a public service message. I now return you to regular progammed blogging.
UPDATE: 30 minutes after the market close. Yes, I was being sarcastic, but on the other hand, even though we had a bad day today, yesterday's intraday low was not breached. It is still the bottom.
Both the King of All Doomers and the Pied Piper of Doom have triumphalist pieces up this morning.
If their past performance is any guide, this means that the bottom of the stock market correction was yesterday afternoon after the Fed announcement.
This has been a public service message. I now return you to regular progammed blogging.
UPDATE: 30 minutes after the market close. Yes, I was being sarcastic, but on the other hand, even though we had a bad day today, yesterday's intraday low was not breached. It is still the bottom.
Tuesday, August 9, 2011
Wednesday Commodity Round-Up
Let's take an in-depth look at gold to get a better idea for the safety bid in the market.

Above is a three year chart of the GLD ETF. Notice that the overall trend is up, using the 200 day EMA as technical support. Along the way we see various consolidation patterns, but always resulting in a technical bounce from an important technical indicator. But also note the large number of upward resistance points what will provide downside support when gold moves lower. Over the last few years, there have been several consolidation areas where traders "caught their breath."

The above chart shows the more recent price action in detail. The EMAs are bullishly aligned -- all are moving higher, the shorter are above the longer and prices are above all -- and prices are using the EMAs for technical support. Also note that aside from the last two days of trading, the candles have consolidated in tight patterns, indicating that traders are waiting and not panicking. However, the A/D and CMF have been declining during the latest rally, indicating prices are not being supported by new money coming in. But, we're still seeing momentum increase.
The lack of incoming money over the latest rally indicates the market may be getting a little tired. But gold is proving to be a great safe haven for investors. While the market is weak, I wouldn't be shorting.

Above is a three year chart of the GLD ETF. Notice that the overall trend is up, using the 200 day EMA as technical support. Along the way we see various consolidation patterns, but always resulting in a technical bounce from an important technical indicator. But also note the large number of upward resistance points what will provide downside support when gold moves lower. Over the last few years, there have been several consolidation areas where traders "caught their breath."

The above chart shows the more recent price action in detail. The EMAs are bullishly aligned -- all are moving higher, the shorter are above the longer and prices are above all -- and prices are using the EMAs for technical support. Also note that aside from the last two days of trading, the candles have consolidated in tight patterns, indicating that traders are waiting and not panicking. However, the A/D and CMF have been declining during the latest rally, indicating prices are not being supported by new money coming in. But, we're still seeing momentum increase.
The lack of incoming money over the latest rally indicates the market may be getting a little tired. But gold is proving to be a great safe haven for investors. While the market is weak, I wouldn't be shorting.
Subscribe to:
Posts (Atom)