Monday, April 26, 2010

More Signs of Expansion Emerge

From the NY Times:


At malls from New Jersey to California, shoppers are snapping up electronics and furniture, as fears of joblessness yield to exuberance over rising stock prices. Tractor trailers and railroad cars haul swelling quantities of goods through transportation corridors, generating paychecks for truckers and repair crews.

On the factory floor, production is expanding, a point underscored by government data released Friday showing a hefty increase in March for orders of long-lasting manufactured items. In apartment towers and on cul-de-sacs, sales of new homes surged in March, climbing by 27 percent, amplifying hopes that a wrenching real estate disaster may finally be releasing its grip on the national economy.

After the worst downturn since the Great Depression, signs of recovery are mounting — albeit tinged with ambiguity. Despite worries that American consumers might hunker down for years — spooked by debt, lost savings and unemployment — thriftiness has given way to the outlines of a new shopping spree: households are replacing cars, upgrading home furnishings and amassing gadgets.

From the WSJ:

Consumers are spending again, delivering a strong boost to first-quarter corporate sales and profits, and prodding some companies to rehire laid-off workers and others to start raising prices again.

From restaurants including Cheesecake Factory Inc., which posted its first increase in sales at stores open at least a year in two years, to high-tech bellwethers such as Intel Corp., which reported its best-ever first-quarter sales and operating income on strong consumer PC sales, buyers returning to their old ways are powering results.

.....

The National Association for Business Economics' latest industry survey shows 57% of respondents reported rising demand in the first quarter, while only 6% said demand fell. It was the third consecutive quarter of rising demand, NABE said.

The April survey also shows job creation increased for the first time in two years, with the percentage of firms adding workers rising to 22% from 13% in January's survey, while those cutting jobs fell to 13% from 28% in January.

As with any expansion, there are going to be questions going forward. For example, is the large amount of consumer debt in the system going to act as a damper on consumer spending? Is the economy capable of expanding after the effects of the stimulus have worn off?

But, the signs are very clear at this point. Manufacturing has been getting better for the better part of a year as indicated by the ISM and regional economic surveys. Personal consumption expenditures are also increasing, as are exports.

Conference Board, ECRI: growth to continue

- by New Deal democrat

One the phrases both Bonddad and I have been using (I'm going to take credit for being first) is that in this global recovery, the American consumer is no longer the locomotive, but the caboose. In particular, China and Asia aren't growing because the US consumer has started to lighten up a little. On the contrary, all of the growth in Asia is in large part responsible for the resumption of American growth.

As a result, both of the top forecasting services, The Conference Board and the Economic Cycle Research Institute (ECRI), are calling for ongoing job growth in the US as the year goes on. Lakshman Achuthan, the managing director of ECRI, described this dynamic - including the offshoring of manufacturing and tech jobs - in a television appearance last week. The video link won't embed. but here are some quotes of highlights:
- "We cut way too far, so as a result we are going to have sustained jobs growth this year."

- "The demand is coming back not only the US but around the world. The problem is it won't be enough to make up for all the job losses for the people who are in the long term joblessless. It's not going to solve [the problem of the need to fun long term unemployment benefits]."

- "All of these [American technological] companies ... are to a degree platform companies where they own intellectual property, and they're sourcing it from around the world..... They're getting a lot of profits out of it, but they're not necessarily creating a lot of jobs out of it."

- "Business spending [is] disproportionately driving the growth.... The[ consumer] is growing at about the same pace as they have in past recoveries.....

- "Asia grew by [ ]17% [during our recession and] They are sucking up a lot of demand. We're exporting to them."
I have been paying a lot of attention to ECRI because they made what was an extremely bold call in March 2009 -- namely, that the Great Recession would bottom out in summer 2009 and a recovery would start. It is easy to remember just how depressed the mood was back at that time. Yet now just about every economist who is on record believes that is exactly when the recession ended.

So let's briefly examine ECRI's outlook one point at a time.

1. Growth will continue:

ECRI continues to be bullish on the economy. Their Weekly Leading Index

rose to a nearly two-year high in the latest week, indicating that the recovery remains underway....
....
That was the highest level since May 23, 2008....

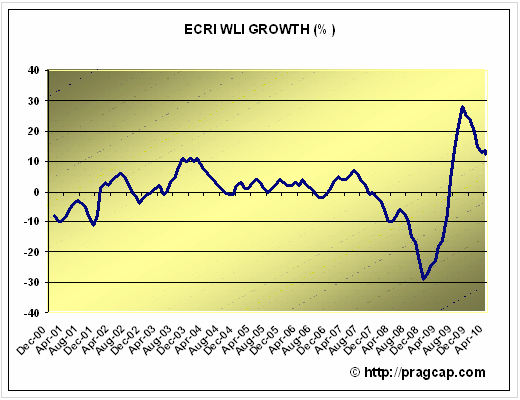
The index's annualized growth rate fell to a 37-week low of 12.5 percent from 12.6 percent a week earlier.

However, "with the WLI rising to a 99-week high, the economic revival will continue in the months ahead,"
said Achuthan.

The following graph of ECRI's leading index shows that a period of torrid growth, better than anything seen in the last 20 years, is expected to throttle back to merely normal expansion as the year wears on.


[h/t Pragmatic Capitalist]

Achuthan has also said bluntly that "a double dip recession remains out of the question,"

As we already know, the other leading forecast organization, the Conference Board, said earlier this month that its Index of Leading Indicators was up 1.4% in March, and on a year over year basis was up 12%. This is the strongest reading in 20 years.

2. Substantial job growth will continue

Last September, responding to complaints by Paul Krugman among others that GDP growth wasn't good enough, that what was critical for average Americans was the issue of jobs, jobs, jobs, I came up with a series of Leading Indicators specifically for job growth.

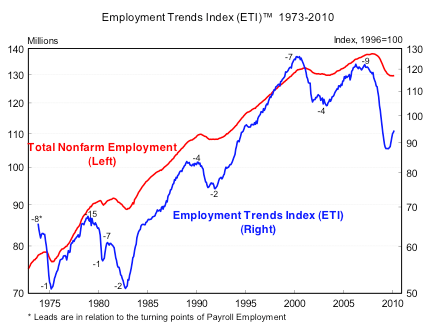
It turns out I wasn't alone. The Conference Board had been looking into the same thing, and a couple of years ago started to publish and "Employment Trends Index," which agglomerate 8 separate statistics and were back-checked 30 years. Here's how that long term graph looked at the beginning of this month:


In their report at that time they said that the Index
rose in March for the seventh consecutive month.... The index is up 5.5 percent from a year ago. Over the past three months, all of the index’s eight components have been improving. “The solid rise in the ETI and the widespread improvement across its components suggest that the March increase in employment was not a fluke and the economy is likely to continue to add jobs in the coming months,” said Gad Levanon, Associate Director, Macroeconomic Research at The Conference Board.
Here is what a close up of the graph, covering the last few years, looks like:
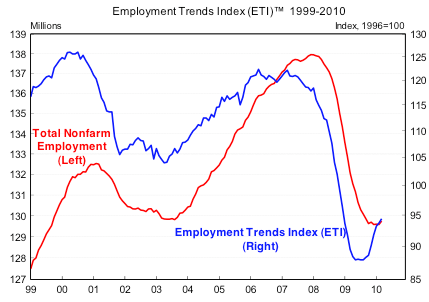


As you can see, the index is rising faster than during either of the two previous "jobless recoveries" but not quite as quickly as the V-shaped jobs recoveries of 1974 or 1982.

Levanon added that “However, we do not expect job growth to significantly accelerate in the short term, as both consumption and investment growth are likely to remain relatively weak."

Since that time, we had the blockbuster March real retail sales report that I discussed last week. It will be interesting to see if the Conference Board also finds that significant for future job growth.

3. The problem of long term unemployment and underemployment

Achuthan believes that it will be impossible for a recovery, even a strong one, to replace the 8 million jobs that have been lost since 2007 (let alone dealing with population growth). Since neither political party is willing to countenance the idea of direct government employment (i.e., a new WPA), either unemployment benefits must be extended indefinetely, or else the long-term unemployed will truly fall into the abyss.

This point could not have been made more starkly by a recent study by Andrew Sum, et al,(pdf) for the C.S. Mott Foundation differentiating between the top 10% of income earners, the middle 20% and the lowest 20%. They found that among the lowest 10% of American workers, unemployment was 20.7%, and another 30.8% were underemployed. meaning that over half of all of the lowest 10% of Americans suffered some degree of employment loss. On the other hand, only 3.2% of the top 10% of Americans were unemployed, and another 1.4% were underemployed, for an overall rate of under 5%. For middle income Americans, the figures were 8.4% and 5.8% for a total rate of 14.2%.

Their conclusion: for the uppermost Americans, there has been no recession at all, but by the time you get to the bottom of the income scale, it has been a true Depression.

4. Asia is the locomotive, American wage-earners are the caboose

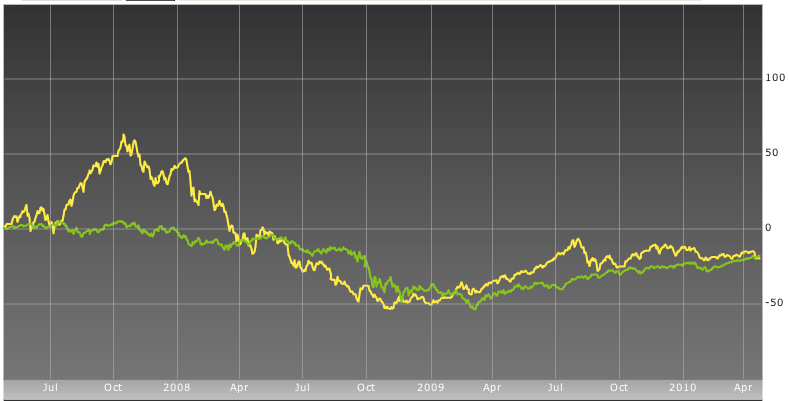
Achuthan's point that Asia is driving the global recovery makes me recall that one of the most telling indications that the baton of global economic leadership had passed, were graphs of when the various global stock markets bottomed. The US' market bottomed in March 2009, but Asian markets all bottomed about 4 months before, in November 2008. For example, here is a graph comparing China's Shanghai market (yellow) with the S&P 500 (green):


According to the IMF, the Asian locomotive is chugging ahead, as they are calling for 10% growth in the Chinese economy this year, and their exports recovering modestly:
Chinese Commerce Minister Chen Deming Friday said he remained cautious about growth of exports this year as recovery in demand for China-made goods in the United States and Europe was still very slow....

"This fair is better than the spring and autumn sessions last year. A majority of exporters reported growth in orders from overseas customers," he said.

Chen, however, warned against blind optimism about trade recovery....

The recovery in demand in major markets like the U.S. and Europe remained very slow, a sign that global demand had not recovered to pre-crisis levels ....

As the Wall Street Journal noted back in December:

"Households have now become a driver in the recovery" across the region, says Frederic Neumann, Asia economist for HSBC. He notes that consumption grew faster than overall output in most Asian economies in the third quarter, a change from earlier in the decade.


But increasing demand is producing rising costs of raw materials and labor that Chinese manufacturers called "their biggest challenge."

Meanwhile, exports at US West Coast ports are up over 10% from a year ago. To put it bluntly, since global wage arbitrage is a huge issue and has been completely unaddressed, growth in the American economy is in large part becoming increasingly poorer American workers employed by global corporations feeding the growth of increasingly richer Asian ones.

Looking ahead, the bite of near $3 a gallon gasoline among other commodities, that now has the Shanghai stock exchange going sideways for the last 6 months, is cause for particular concern for the American working/middle class that has become the caboose in the global recovery.

Regarding the Durable Goods Orders

The latest durable goods orders came out last week, but there are important points to make about it. First, the overall trend was a decrease of 1.3%. But the number excluding transportation equipment showed an increase of 2.8%. And the drop in transportation equipment was caused primarily by a 67.1% drop in non-defense aircraft and parts. This particular segment of the durable goods report accounted for 5.45% of the February new orders number number and 1.81% of the March new orders number. I can't think of another time when a drop of that magnitude occurred in any part of the durable goods number. Sharp drops usually do come from the transportation section of the report, but by sharp I'm thinking along the lines of 10%. In other words, the 67% drop is very much out of the ordinary.

Market Mondays


The big mover last week was the Russell 2000 which has the best performing of the Dow, S&P 500 and NASDAQ. Let's take a look at the daily 5 minute chart.


a.) The index had a double bottom on Monday, which moved into an upward sloping trend (b). Along the way prices consolidated in several pennant patterns (c).

d.) Price broke the a uptrend on mid-Tuesday, but prices resumed their uptrend (d).

On Tuesday and Wednesday, prices essentially consolidated (e).

On Thursday and Friday prices formed an upward sloping trend channels.

Now, let's look at a something very important -- whether the IWMs are overbought. Consider the following chart of the IWMs.


Pay particular attention to the MACD, which I've made larger to accentuate the point. Notice the MACD is at incredibly high levels, implying the market is at extreme overbought levels right now. Notice that we have the same situation with the other averages -- extremely overbought levels:


Friday, April 23, 2010

Weekend Weimar and Beagle

It's that time of the week -- time to think about anything except the markets.

We'll all be back on Monday


Weekly Indicators for April 23, 2010

- by New Deal democrat

This was housing week in the monthly data department. Both existing and new home sales increased, new sales surprisingly so. I am taking both of these with a grain of salt, since the $8000 home buyers credit has been playing havoc with the numbers.

Durable goods orders for March tanked, including airplanes, but were surprisingly strong excluding airplanes (Boeing). This is a volatile number, so best not to read much into it either way.

The high frequency weekly data continued to tell a tale of a strengthening recovery:

▪ The International Council of Shopping Centers (ICSC) reported same store sales growth of 4.6% YoY, and 0.2% WoW.

Shoppertrak reported YoY sales increased 9.9%, and WoW sales were up 4.7% (note easy Easter comparison vs. last year).

The Department of Energy reported that the price of gasoline rose again, just barely, to $2.86 per gallon. Gasoline demand for the last month has run equal with last year, suggesting that prices are beginning to bite at least slightly.

The BLS reported that last week's initial jobless claims totaled 456,000. The 4 week moving average was 460,000. This series remains in a downtrend, but in a much more muted downtrend than last year.

Railfax recorded another strong week. Three of the four elements of traffic: baseline, cyclical, and total – are continuing to increase, and continuing to increase at a rate faster than last year. Intermodal traffic, which is a proxy of imports/exports, remains substantially ahead of last year, but is not significantly increasing. Crushed stone and lumber, Railfax’s “recession watch” traffic, have both increased over last year for a month now, and crushed stone is increasing substantially WoW in comparison with last year.

Finally, Daily treasury receipts continue their surge ahead of last year. As of April 21, 2010 (15 reporting days into the month), $105.2B in withheld taxes had been collected vs. $98.8B last year, a gain of $6.4B or +6.5%. For the last 20 reporting days, $130.0B in withholding taxes have been collected, vs. $118.6B last year, a gain of $11.4B or +9.6%.

From Bonddad:

According the Gallup:
Gallup estimates that more than 1.5 million Americans who were underemployed became employed to full capacity over the last month. Gallup's 30-day average underemployment measure (not seasonally adjusted) declined to 19.2% on April 18 -- a sharp improvement from the 20.2% reported on March 21 -- and essentially matching its best level of the year.
I point this out because one of this website's trolls has changed his economic indicators every time they turn positive. For example, he no longer quotes the BLS (which is rigged -- rigged I tell you!!!!!!) but instead relies on Gallup. However, now that this number reporting positive news, he'll have to find a more negative jobs number to claim is accurate.

Porn or Enforce the Law?

From the AP

Republicans are stepping up their criticism of the Securities and Exchange Commission following reports that senior agency staffers spent hours surfing pornographic websites on government-issued computers while they were supposed to be policing the nation's financial system. California Rep.

Darrell Issa, the top Republican on the House Oversight and Government Reform Committee, said it was "disturbing that high-ranking officials within the SEC were spending more time looking at porn than taking action to help stave off the events that put our nation's economy on the brink of collapse." He said in a statement Thursday that SEC officials "were preoccupied with other distractions" when they should have been overseeing the growing problems in the financial system.

The SEC's inspector general conducted 33 probes of employees looking at explicit images in the past five years, according to a memo obtained by The Associated Press. The memo says 31 of those probes occurred in the 2 1/2 years since the financial system teetered and nearly crashed.

The staffers' behavior violated government-wide ethics rules, it says. The memo provides fresh ammunition for Republicans who suspect the timing of the SEC's lawsuit last week against Wall Street powerhouse Goldman Sachs Group Inc. News of the suit came as the Senate prepared to take up a sweeping overhaul of the rules governing banks and other financial companies.

Ratings Agencies Dropped the Ball

From the NY Times:

In 2004, well before the risks embedded in Wall Street’s bets on subprime mortgages became widely known, employees at Standard & Poor’s, the credit rating agency, were feeling pressure to expand the business.
One employee warned in internal e-mail that the company would lose business if it failed to give high enough ratings to collateralized debt obligations, the investments that later emerged at the heart of the financial crisis.

“We are meeting with your group this week to discuss adjusting criteria for rating C.D.O.s of real estate assets this week because of the ongoing threat of losing deals,” the e-mail said. “Lose the C.D.O. and lose the base business — a self reinforcing loop.”

.....

In June 2005, an S.& P. employee warned that tampering “with criteria to ‘get the deal’ is putting the entire S.& P. franchise at risk — it’s a bad idea.” A Senate panel will release 550 pages of exhibits on Friday — including these and other internal messages — at a hearing scrutinizing the role S.& P. and the ratings agency Moody’s Investors Service played in the 2008 financial crisis. The panel, the Permanent Subcommittee on Investigations, released excerpts of the messages Thursday.

The released documents will be very interesting to read.


States' Revenues probably bottomed in Q1 2010

- by New Deal democrat

Last week the Rockefeller Institute issued its report on state finances [pdf] for the 4th quarter of 2009. Since it covers finances from 4 to 6 months ago, this is very lagging data. What is noteworthy is that the trend strongly suggests that on an annual basis state finances hit bottom at some point in the 1st quarter of this year, probably January or February, and are positive YoY now.

This by no means indicates that the states are out of the woods, or that more painful cutbacks aren't in store this year. In fact, if anything it makes the case for another big round of federal loans to the states to bridge the gap in their finances until they recover further.. Nevertheless, it appears the bottom has been reached. Here is the bullet-point summary of the Rockefeller Institute's report:
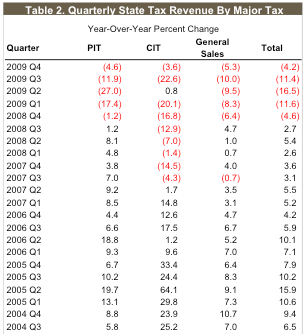
Total state tax revenues in the fourth quarter of 2009 declined by 4.2 percent relative to a year ago. The income tax was down by 4.6 percent, the sales tax was down by 5.3 percent, and the corporate income tax declined by 3.6 percent [vs. a year previously].
....
Preliminary figures for January and Februrary for 45 early-reporting states show continued weakness, with personal income collections dropping 7.1 percent and overall tax collections dropping 2.2 percent from a year earlier.
....
Preliminary figures for the 41 of 45 early reporting states with broad-based sales tax indicate that sales tax collections saw some trivial yet positive growth at 0.1 percent in January-February 2010 compared to the same period of 2009, but nonetheless the sales tax in the median state for these two months was down 4.2 percent. While March data could change the picture, the sales tax could see small positive growth in the January-March quarter as a result of stabilizing retail sales and consumption as well as legislated changes in several states
Note that these are all year-over-year calculations. The Rockefeller Institute explains that while
most economic time series have been adjusted to remove seasonality so that comparisons from one period to the next are meaningful[, g]overnment tax data, by contrast, rarely are adjusted to remove seasonal variations....
Looking at revenues on an annualized basis also makes sense because states are interested in how revenues compare with their annual budgets.

Although it was to be expected that on a year-over-year basis, state tax revenues would be worse in 2009 than 2008, given the freefall in the economy at the end of 2008 which bottomed in 2009, more important for our purposes is what the trend in tax collections portends for 2010. Here, the story is decidedly mixed, but late-breaking information suggests the turnaround probably occurred in March.

First of all, here is a chart from the Rockefeller Institute report, showing the trend in income, sales, and personal, corporate and sales taxes collections for the last 5 years


As you can see, tax collections fell off a cliff following the meltdown of September-October 2008, with YoY collections bottoming at (-27%) in the second quarter of 2009. If the upward trend of (+7.3 %) in the rate of change from the 3rd to 4th quarter of 2009 continues through the 1st quarter of 2010, Q1 2010, it will show a positive YoY comparison in tax collections.

When the Rockefeller Institute was preparing their report, they were pessimistic on this score:
[P]reliminary data on tax collections in January and February in 45 states show that year-over-year increases are few and far between. Tax revenue is continuing to decline in the median state, and at this point it appears as if the January-March quarter will have declines in the median state. … athough there is evidence of further slowing in the rate of decline. With preliminary data for January and February now available for 45 states, tax revenue for the two months combined has declined further by 2.2 percent versus the same period last year. About 84 percent of states reporting personal income tax data had a year-over-year decline, with a median decline of 7.1 percent, while 80 percent of states reporting sales-tax data had a year-over-year decline.
As indicated above, the late breaking news is March. The Rockefeller Institute report itself noted that "March data could change this troubling picture" and there is reason to believe it indeed has. According to the March 30 edition of Business Week:
The two-year slide in tax collections that opened a $196 billion gap in U.S. state budgets has stopped, easing pressure on credit ratings and giving leeway to lawmakers as they craft spending plans for next year. The 15 largest states by population forecast a 3.9 percent gain in tax revenue in fiscal 2011, budget documents show. The 50 states on average may increase collections by about 3.5 percent, the first time in two years the figure is expected to grow, said Mark Zandi, chief economist at Moody’s Economy.com. California took in 3.9 percent more since December than projected in January, Controller John Chiang said this month. New York got $129 million above forecasts in its budget year through February, according to a report from Comptroller Thomas DiNapoli. In New Jersey, the second-wealthiest state per capita, January sales-tax collections were 1.9 percent higher than a year earlier, the first annual increase in 19 months, forecasters said in a report last month.
In addition to California, New York, and New Jersey, I have been following about half a dozen other states to see when their sales tax revenues would increase YoY, ending any doubts about the upward turn in retail sales. Here are the results as of their latest reports:

- Ohio March sales tax receipts were up +2.4% YoY
- Pennsylvania sales tax receipts were up +8.5% YoY in March
- Alabama sales tax collection up +3.1% YoY in March
- Florida, which had been doing horribly, had sales tax revenues down only -0.6% YoY in March (compared to -4.3% in January, -4.9% in December and -8.1% in November)
- Tennessee, which had also been doing poorly, showed total tax revenues down only -0.4% in February, (compared with -1.8% in January, -2.9% in December, and -4.5% in November)
- Indiana, although still down -3.1% in March, was also an improvement from prior months (-4.3% in December, -6.1% in November)
- Texas, the only large state still doing poorly, reported sales taxes still down -7.8% in March, but overall revenues were up YoY. The sales tax decline was still a vast improvement over prior months' reporting, such as the -14.2% YoY decline in January.

As a side note, I am tracking these states in particular in response to the King of All Doomish Bloggers, Mish, who cited these states as proof that state sales tax receipts have not mirrored retail sales data, which turned YoY positive in October 2009. On this score, the Rockefeller Institute provides the perfect rejoinder:
while real retail sales have been rising from their lows for about the last year, they are still more than six percent below their prerecession peak. So even if sales taxes mirrored retail sales, they would be well below their recession peak. In fact, though, many state sales taxes exempt food and other necessities, and exempt or exclude many services, relying more heavily on non-necessities. Many of these taxable goods and services — such as cars, other durable goods and restaurant meals — are far easier to do without or postpone than are necessities and they tend to be more volatile and suffer greater declines in business downturns.
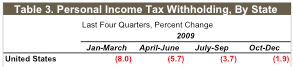
All of this is confirmed by what is happening with taxes paid to the Federal government. The Treasury Department publishes a daily report of its income and payouts. Even as the economy as a whole began to recover late last year, tax receipts were still down on a YoY basis (this is why raw YoY reports are problematic, unless you know the trend in the YoY numbers. A series inevitably will turn up from a bottom, but still be negative YoY for a number of months. Here is the Rockefeller Institute's headline chart entry as to personal tax withholding for the year 2009:
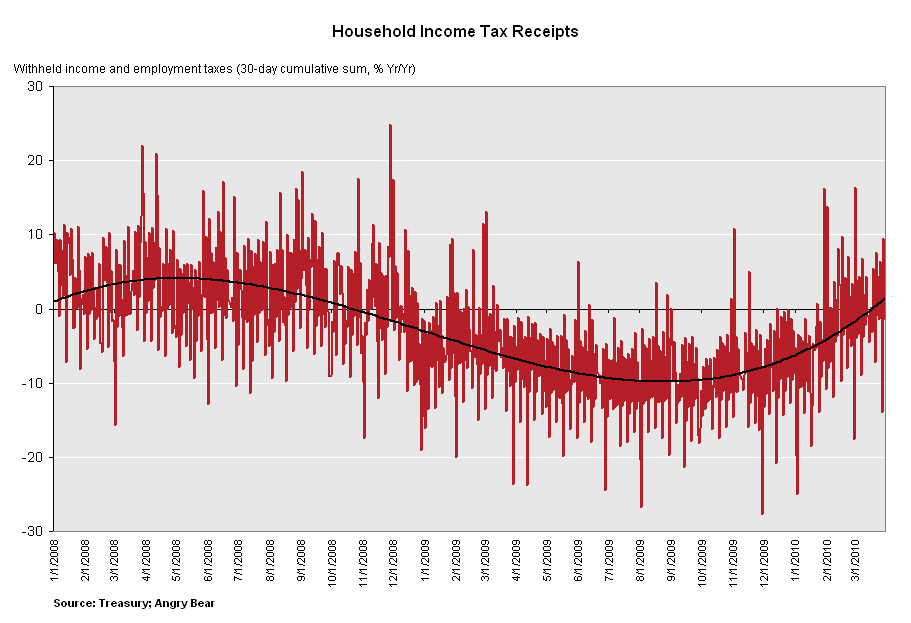
Given this trend, you would expect the comparison to turn positive in the first quarter of 2010, and according to the US Treasury Department, it did. Total receipts for February withholding tax receipts were only down -2.3% YoY, compared with January's -6.7% YoY shortfall. By the end of March, however, YoY tax receipts were UP 5% for the month. That improvement has continued this month. As of the latest report, April 2010 withholding tax collections were ahead of April 2009's collections by 6.5%. The below graph, which I have posted here before, is about 3 weeks old, but the trend is clear and speaks for itself:

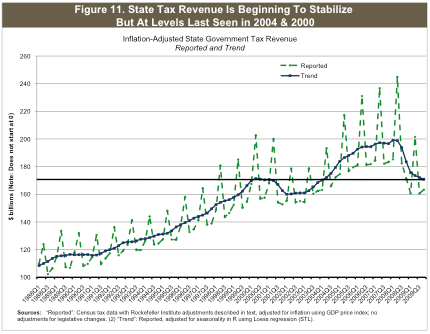
So, are happy days here again? Of course not. Having most likely reached the bottom of the cliff, the states are on an absolute basis at the worst levels in decades, as reflected in the draconian cuts many states are making in their budgets. Undoubtedly some will have to continue to lop off many important services to bring their budgets into balance at this low level. The Rockefeller Institute believes that the average state has suffered a crushing loss of 18% in tax revenues from peak before the Recession, even if revenues are beginning to stabilize in early 2010:


What this post shows is that the fiscal situation is unlikely to get much worse. and should get better from here. The Rockefeller Institute report itself notes that it will probably take a number of years for states to repair the damage. The Business Week article noted that, although tax revenues are up compared with 2009,
This fiscal year, the 15 largest states expect to collect 11 percent less taxes than in fiscal 2008, budget proposals show. It won’t be until 2013 that revenue returns to 2008 levels, said New Jersey’s Rosen and Barry Boardman, the North Carolina General Assembly’s chief economist.
In the meantime, a continued Federal line of life support is necessary. Allowing fiscal assistance to the states to expire would be the worst kind of Hooverism (and actually, that's a slander on Herbert Hoover). The Federal government should extend low-interest grants to the states which do not have to be repaid until state budgets firmly reflect economic expansion.

Yesterday's Market

Let's take a look at the difference between the IWCs (micro-caps) and the SPYs (large caps)


a.) Prices move higher on a strong bar

b.) Prices inch higher, buy print small, bearish bars

c.) Prices again move higher strongly

d.) Prices consolidate

e.) Prices again move higher on a strong bar

However, notice there is a consistent uptrend and the bars are all moving to a place.


With the SPYs, we have three boxes of price movements, but there is little strong direction.

This is why the smaller cap issues have been leading the market.

Forex Fridays


The dollar is in a clear uptrend and has consolidated in several downward sloping pennants (a and b). In addition, the dollar is in a solid uptrend at point c. However, there is a strong fundamental reason for the upswing, largely caused by the situation is Greece which is leading to a flight for safety. In addition, notice the dollar and the euro are inversely related:

Thursday, April 22, 2010

More of SilverOz's Thought Experiment

The ratings agencies are a big part of the problem. Most large institutional investors have funds that have specific investment guidelines, such as they won't invest in a bond that is below single a. By giving crap bonds a aaa rating, they allowed a lot of funds to invest in terrible paper. If the ratings agencies had done their job, they could have limited the fallout because fewer institutions would have purchased the lower rated bonds.

In my opinion the ratings agencies were central to the problem.

As if on cue:

A Senate panel is blaming credit rating agencies for helping banks disguise the risks of investments they marketed.

The Permanent Subcommittee on Investigations says in a report that the rating agencies relied on hefty fees from banks, which wanted them to rate risky investments as safe.

Ratings Agency Thought Experiment

I am posting this with a h/t to Barry Ritholtz over at the Big Picture who gave me an idea with his post on Fannie Mae regarding what would have happened had we completely removed FNM from the picture. I want to run a similar thought experiment, but replace FNM/FRE with the "ratings agencies" (ie Fitch, Moody's, and S&P).

Facts: The ratings agencies fell over themselves to give virtually all MBS "aaa" ratings no matter what the composition of the underlying assets (see ABACUS for a great example).

The Hypothetical Counter Factual: Way back when the first MBS is presented to the ratings agencies that has even one slice of subprime/alt-a/NINJA in it the agencies gave the MBS a rating less than "aaa" and further marked them down more based on the share of non-prime loans. The idea being that if a MBS comprised entirely of fully amortizing prime loans is "aaa", then anything even a bit less than that cannot get a "aaa" rating.

Question: Would the housing bubble/bust have still occurred? Would we have had a credit crisis? Would banks have fought over themselves to make any loan they could? Would it have even had to come down to the regulators?

Since I believe the answer to all these questions is in fact NO, then it seems to me we may have the root cause of our problem (and one that is not addressed in the "reform" package).

Jobless Claims Drop


From Bloomberg:

Initial jobless claims fell back to trend in the April 17 week, coming in at a largely as-expected 456,000 and reversing two weeks of administrative delays that swelled claims to as high as 480,000 in the prior week (revised from 484,000). The 456,000 level compares with 445,000 in the March 20 period, offering a flat comparison at best to gauge monthly payroll change. Despite the distortions of the prior two weeks, the four-week average shows a similar comparison: at 460,250 vs. 454,000 at mid-March. Continuing claims for the April 10 week fell 40,000 to 4.646 million with the four-week average down slightly to 4.644 million.


While the drop is good, notice that on the chart we're still in a range of 450-475/480.

Temporarily deleted while I clean up this post!

This post accidentally went "live" while I was trying to clean it up. I'll repost once done.

In the meantime, apologies to Brodero!

Update: Cleaned up and made presentable, here.

Yesterday's Market

The main issue this week is will the markets hold to their trends? There is a tremendous amount of downward pressure right now, largely from the Greek situation. So far, we've held, but the futures are trading lower as of this writing....


Thursday Oil-Market Round-Up


a.) Prices broke this uptrend three days ago, in the correction that started with the SEC's Goldman suit.

b.) This line of resistance is important for prices right now.

c.) Prices are currently in a downward sloping pennant pattern.

d.) The EMA picture is still bullish -- the shorter EMAs are above the longer EMAs. But there are important caveats now. Prices are below the 10 and 20 day EMA, both EMAs are moving lower and the 10 day EMA is about to cross below the 20 day EMA. This is not as important a development as you might think. largely because the 10 and the 20 day EMA are obviously more sensitive to price action. But it is definitely something to keep in mind as both now provide upside resistance.

e.) Momentum is moving lower but

f.) There is still money flowing into the market.

Wednesday, April 21, 2010

Welcome to Abnormal Returns Readers

We are glad you are here and pleased to be linked to from such an important blog.

Good News For the Bond Market

From Reuters:

Rising tax receipts will likely reduce U.S. government borrowing needs in the rest of this fiscal year and fiscal 2011, Morgan Stanley said on Wednesday.

Less supply may end up hurting bonds because it signals an improving U.S. economy -- which is typically negative for Treasuries, the U.S. investment bank's analysts said in a research note.

They predicted U.S. long-dated Treasury supply would fall by $52 billion for the remainder of fiscal 2010 and by $589 billion in fiscal 2011.

"While we are encouraged by this improvement it's hard to get too excited because it's like drowning in 75 feet of water instead of 100 feet of water," they wrote in the note.

Read This Now

Over at Macroblog there is a great discussion on bank size. As always, the issues are incredibly complicated.