- by New Deal democrat
On Friday I noted that the week's data about the American consumer and industrial economies was so different that you may as well be looking at statistics from two separate countries. Looking at other data series over the weekend, I was surprised to find that the stark bifurcation between the two economies - industrial vs. consumer - carried through almost all the data series. The recovery is indeed bifurcated. The industrial recovery is V-shaped and stronger than any recovery since 1983. The consumer economy is little better than L-shaped and in some cases isn't happening at all. What follows is a detailed look.
I. Let's start with the overall GDP, shown here in real, inflation-adjusted terms:
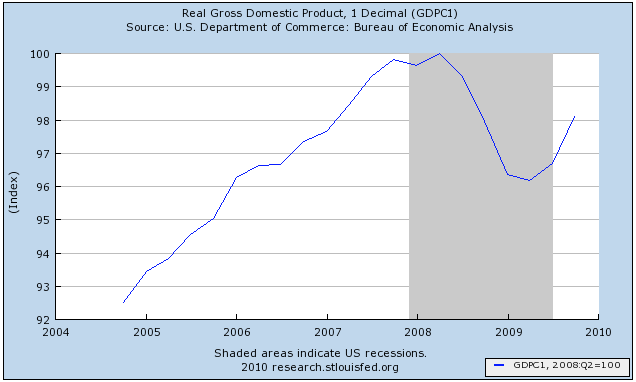
The economy as a whole declined about 4% in real terms from its peak in 2Q 2008. It is over half the way back, as V-shaped as could have been hoped for.
That V-shaped recovery also shows up in industrial production:
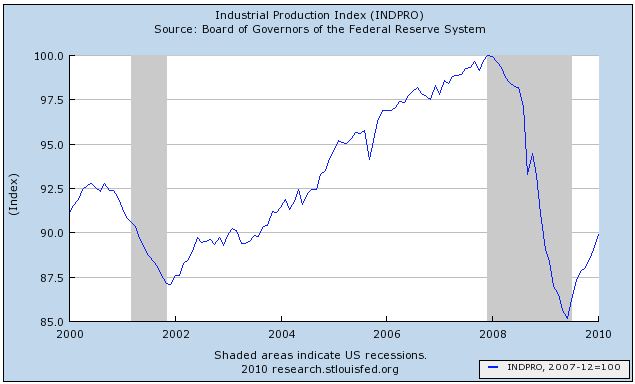
Industrial production declined 15% from its peak and has recovered 1/3 of its loss.
This is the strongest recovery in industrial production by far since 1983:

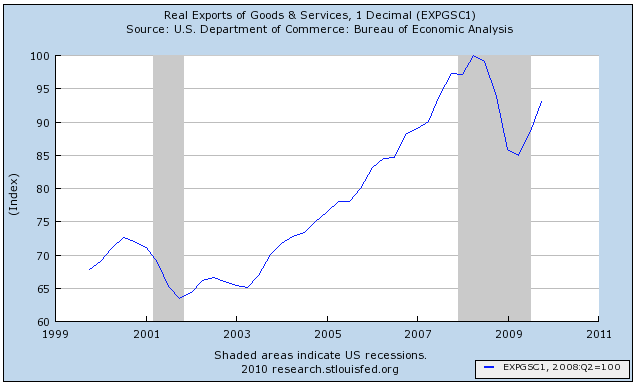
Exports have also regained over half of the ground they lost:
And V-shaped charts turn up in virtually every other aspect of manufacturing, for example, the latest ISM manufacturing report from January:
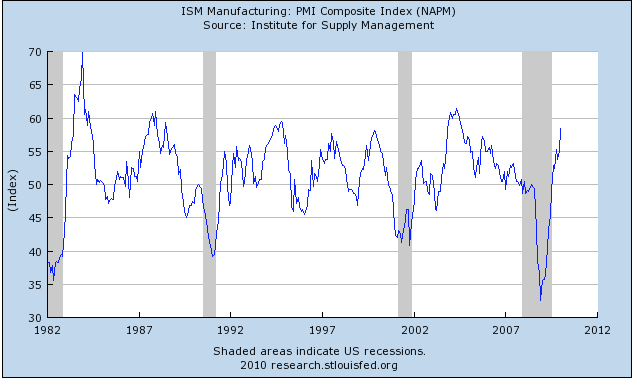
showing a much stronger recovery than either those from the 1991 and 2001 recessions, and showing an intensity of growth that has only been matched in 1994 and 2003 in the last 20 years.
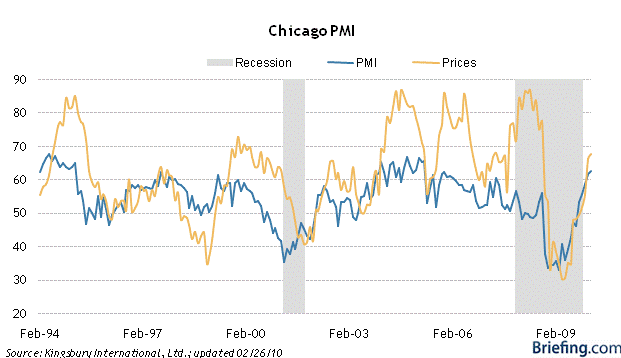
The Chicago PMI for February, which was just reported on Friday, shows a similar intensity:
Looking at some subparts of the industrial economy, this graph shows durable goods manufacturing and employees so employed:
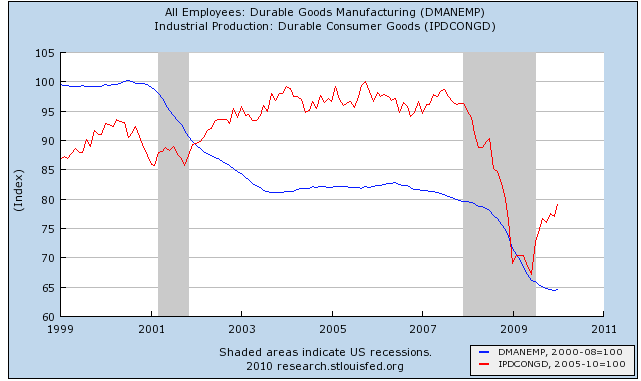
Durable goods declined almost 35% from their pre-recession peak and have come over 1/3 of the way back. That hasn't helped durable goods employment, which declined 20% and just turned positive on a preliminary basis in January.
The same story has played out in nondurable goods manufacturing and employees in that sector:
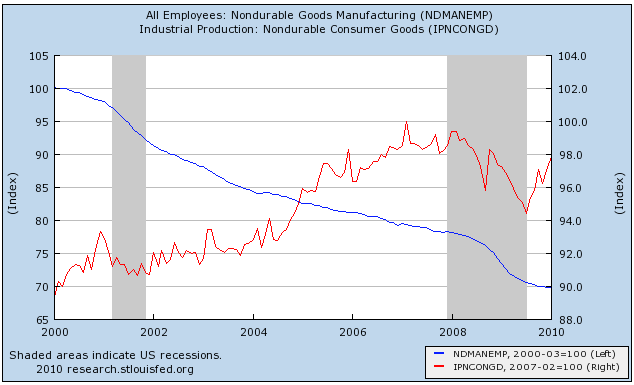
Nondurable goods manufacturing declined about 6% from its pre-recession peak (right scale) and has made 2/3 of that up. Employment in that area is still in decline.
The V-shaped recovery also shows up in average weekly hours (blue, left scale) and overtime (red, right scale) worked in manufacturing:
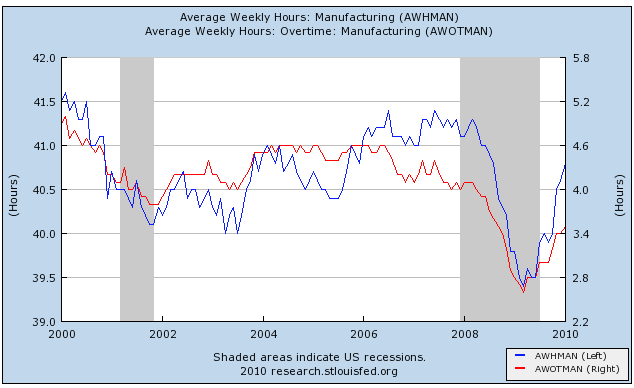
But if hours have gone up, the sector continued to hemorrhage jobs as shown on this graph of monthly gains and losses in industrial employment:
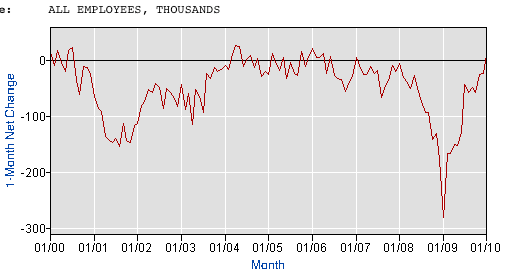
Industrial employment finally eked out an +11,000 gain on a preliminary basis in January's jobs report.
II. Over 100 years ago, Charles Dow (of the Dow Jones Industrial and Transportation Averages) theorized that the amount of goods produced should correlate with the volume of traffic moving those goods to market. Indeed, as we saw last week, the trucking industry has recovered about 2/3 of its volume:

Nondurable goods manufacturing declined about 6% from its pre-recession peak (right scale) and has made 2/3 of that up. Employment in that area is still in decline.
The V-shaped recovery also shows up in average weekly hours (blue, left scale) and overtime (red, right scale) worked in manufacturing:
But if hours have gone up, the sector continued to hemorrhage jobs as shown on this graph of monthly gains and losses in industrial employment:
Industrial employment finally eked out an +11,000 gain on a preliminary basis in January's jobs report.
II. Over 100 years ago, Charles Dow (of the Dow Jones Industrial and Transportation Averages) theorized that the amount of goods produced should correlate with the volume of traffic moving those goods to market. Indeed, as we saw last week, the trucking industry has recovered about 2/3 of its volume:
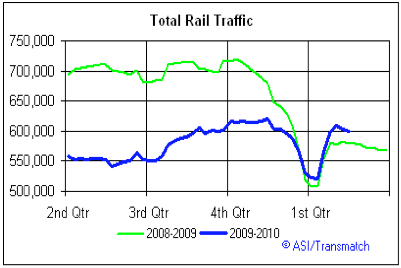
Total rail traffic declined almost 30% from peak to bottom in late 2008. Some of that was seasonal, but the fact remains that about half of that decline has been erased:
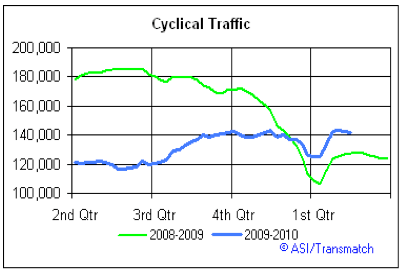
Cyclical rail traffic, which is most sensitive to economic conditions, and which did improve first following the 2001 recession, shows a similar pattern:
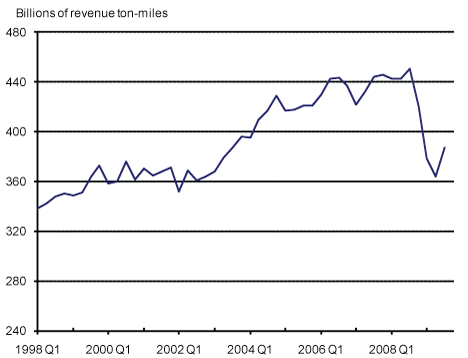
Railroad revenue ton-miles, which are reported quarterly, show about 1/3 of the lost ground recovered through December 2009:
Cyclical rail traffic, which is most sensitive to economic conditions, and which did improve first following the 2001 recession, shows a similar pattern:
Railroad revenue ton-miles, which are reported quarterly, show about 1/3 of the lost ground recovered through December 2009:
Although I can't show you a graph, I can tell you that air cargo revenue ton-miles show a smaller rebound as well, having fallen 2/3 from 1.22 Billion in December 2006 to 0.75 Billion in February 2009, and as of November 2009 had increased to 0.92 Billion (note: like rail traffic, undoubtedly some of this is seasonal variation, but the YoY decline from Feb. 2008 - 09 was 50%. November 2009 showed the first YoY increase since April 2007-08).
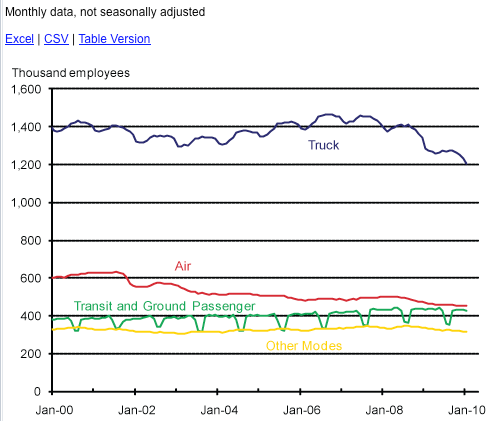
But despite that improvement, employment in the transportation industries was still declining even in January:
III. If industry and associated economic metrics show a strong V-shaped recovery, the best since 1983, then once we look at that part of the economy most closely associated with average American consumers, another picture emerges entirely.
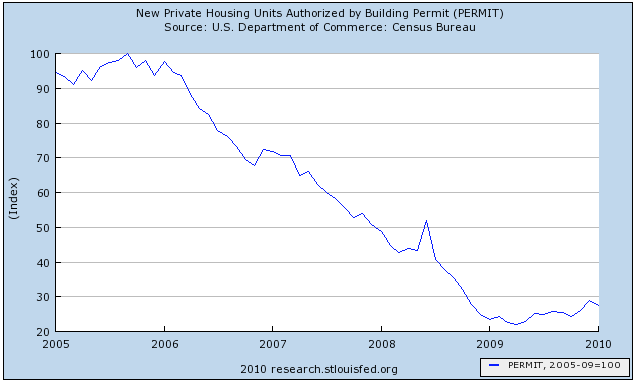
Real residential spending has typically powered consumer recoveries. Housing permits, however, after collapsing nearly 80% from their levels during the boom, have made up only about 10% of that ground -- the weakest housing recovery on record, including the Great Depression:
(note: I am addressing volume of new homes built, not prices of either new or existing houses, in this discussion. Foreclosures are likely to increase for several years yet, and prices are almost certainly going to resume their decline to the long term mean).
III. If industry and associated economic metrics show a strong V-shaped recovery, the best since 1983, then once we look at that part of the economy most closely associated with average American consumers, another picture emerges entirely.
Real residential spending has typically powered consumer recoveries. Housing permits, however, after collapsing nearly 80% from their levels during the boom, have made up only about 10% of that ground -- the weakest housing recovery on record, including the Great Depression:
(note: I am addressing volume of new homes built, not prices of either new or existing houses, in this discussion. Foreclosures are likely to increase for several years yet, and prices are almost certainly going to resume their decline to the long term mean).
Courtesy of Calculated Risk, we can break out residential vs. non-residential construction spending:
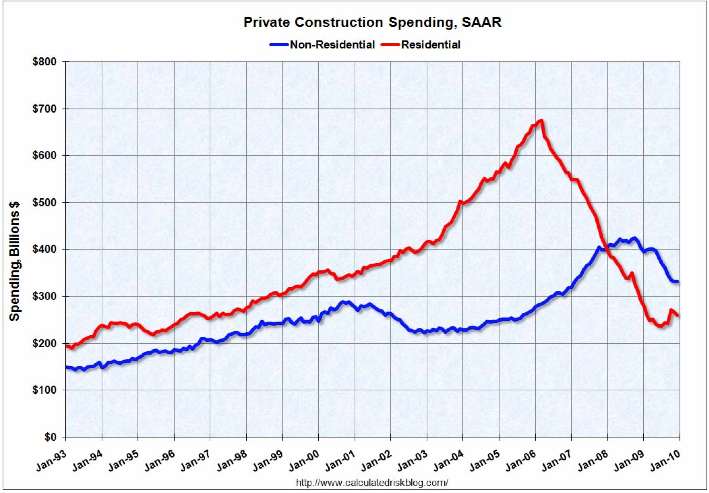
Rsidential spending has improved, but has relapsed somewhat due to the (believed) expiration of the $8000 housing credit. Commercial construction is still in strong decline, and probably will be so at least until later this year (CR notes that historically commercial spending has usually bottomed about 16 months after residential spending).
Rsidential spending has improved, but has relapsed somewhat due to the (believed) expiration of the $8000 housing credit. Commercial construction is still in strong decline, and probably will be so at least until later this year (CR notes that historically commercial spending has usually bottomed about 16 months after residential spending).
Reflecting that, construction employment continues to decline relentlessly (it was one of two areas responsible for January's preliminarily negative jobs report):
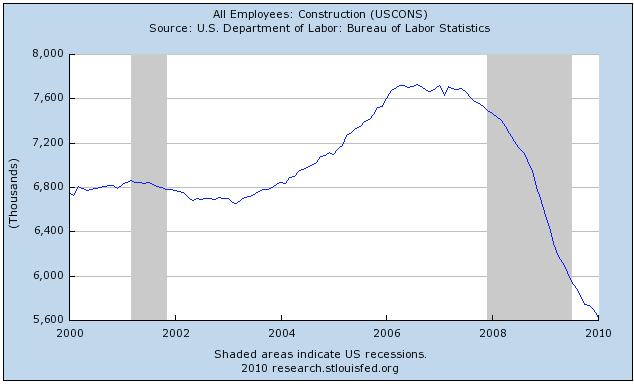
Over two million jobs have been lost in construction since its late 2005 peak. (note: there is no data breaking this down between residential vs. commercial construction jobs)
Over two million jobs have been lost in construction since its late 2005 peak. (note: there is no data breaking this down between residential vs. commercial construction jobs)
If houses are typically the largest and most important purchases made by consumers, autos are second. Auto sales declined from about 16 million a year to 9 million in early 2009, and have since rebounded to about 11 million, or about 25% of the way back to their peak:
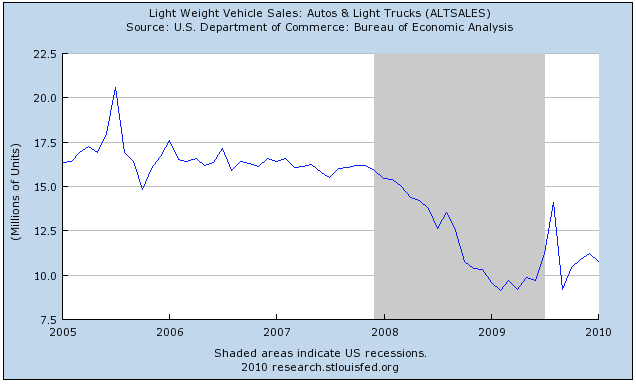
This is a better situation than housing, but not nearly as strong a rebound as in the industrial economy.
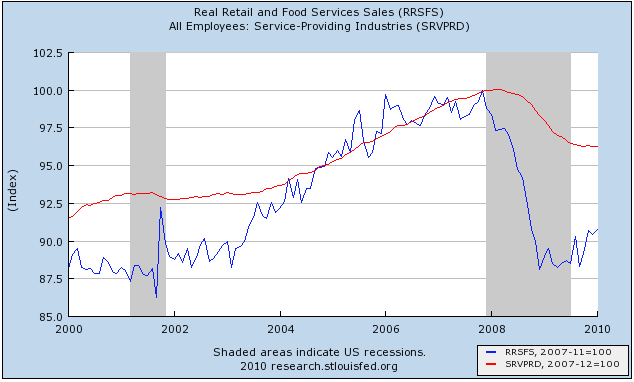
Real retail sales (blue) which make up about 70% of consumer spending, declined about 12.5% from their pre-recession peak, also increased from their bottom, but only made up about 1/5 to 1/4 of that loss. Employment in the service part of the economy (red) declined almost 4%, and just started to eke out small gains in November's jobs report:
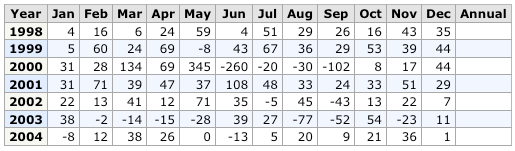
Government employment now includes more workers than all goods-producing employment. It is typically the last to turn down in a recession, and the last to turn up, sometimes not doing so until a year later. For example, here is the graph of gains and losses in government employment on a monthly basis during the 1970s:

and here is the chart of the same data, showing that even after the economy began to recover from the deep recessions of 1973-74 and 1981-82, employees in government continued to be laid off:

and here is the chart of the same data, showing that even after the economy began to recover from the deep recessions of 1973-74 and 1981-82, employees in government continued to be laid off:
Here is the same graph as to the 2001-03 recession and "jobless recovery":

and here is the chart of the same data, showing again that government employees continued to be laid off even into 2004, even after employment as a whole turned up in late 2003:
In the last 8 months, there have been signficant layoffs in government. This undoubtedly is due to the steep decline in revenues, which is reflected in the US Treasury receipts for withholding taxes, shown here (h/t to RDan at Angry Bear):
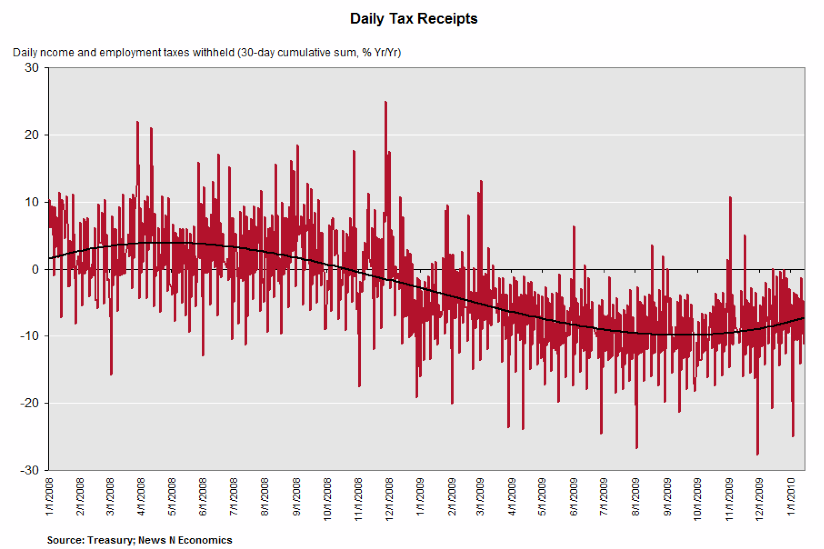
Daily fluctuations in YoY receipts are in red, the 30 day YoY moving average is the black dotted line. While as of February 25, 2010, this had improved to about -2% YoY, there is every reason to believe that there will be significant layoffs of government workers for the foreseeable future. Government was the second area responsible for the continuing job losses in the economy reported preliminarily in January.
and here is the chart of the same data, showing again that government employees continued to be laid off even into 2004, even after employment as a whole turned up in late 2003:
In the last 8 months, there have been signficant layoffs in government. This undoubtedly is due to the steep decline in revenues, which is reflected in the US Treasury receipts for withholding taxes, shown here (h/t to RDan at Angry Bear):
Daily fluctuations in YoY receipts are in red, the 30 day YoY moving average is the black dotted line. While as of February 25, 2010, this had improved to about -2% YoY, there is every reason to believe that there will be significant layoffs of government workers for the foreseeable future. Government was the second area responsible for the continuing job losses in the economy reported preliminarily in January.
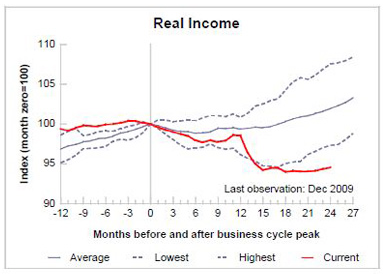
IV. Finally, I would be remiss if I did not look at income and wages. Because of high unemployment and slack in production capacity, there was been much downward pressure on wages and salaries. As a result, after a big decline, real income has stagnated, just barely turning up in the last few months, and lagging the turnaround in all post-WW2 recessions:
Wages are in more severe trouble. In the graph below, average hourly earnings are in green, and the employment cost index (which is a median measure which does not get upwardly distorted by salaries at the upper end of the income scale) is in blue:
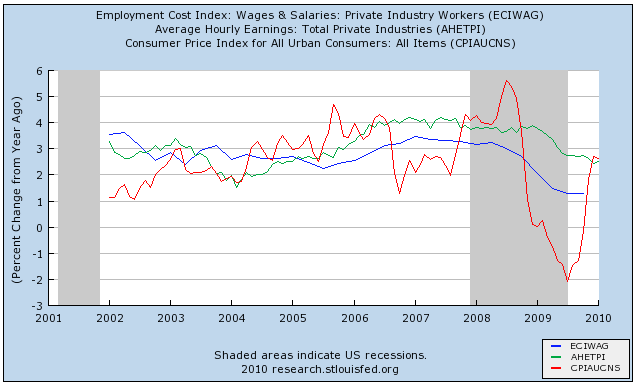
As you can see, both have been under intense downward pressure since the onset of the recession, and when one takes into account inflation (in red), both are now negative on a year-over-year basis. Quite simply, wages - which had a respite during the brief interval of low gas prices a year ago - aren't undergoing any recovery at all.
Wages are in more severe trouble. In the graph below, average hourly earnings are in green, and the employment cost index (which is a median measure which does not get upwardly distorted by salaries at the upper end of the income scale) is in blue:
As you can see, both have been under intense downward pressure since the onset of the recession, and when one takes into account inflation (in red), both are now negative on a year-over-year basis. Quite simply, wages - which had a respite during the brief interval of low gas prices a year ago - aren't undergoing any recovery at all.
But if wages are in real decline, there is yet one more graph that is probably the most V-shaped of them all. S&P 500 earnings, which almost entirely disappeared during the past recession - for the first time since the worst days of the 1929-32 contraction - have almost all been made up (h/t chartoftheday):
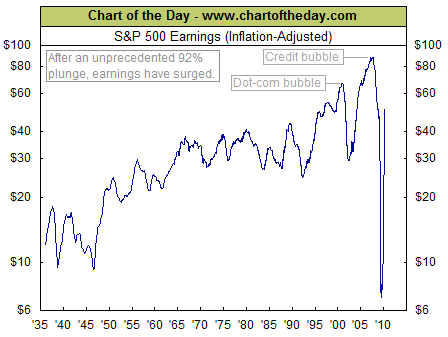
In real terms, profits at America's largest companies are the highest they have even been with the exception of the dot-com and housing bubbles.
In summation, we really do have two separate economies:
(1) an industrial and export economy, which is in a strong, full, V-shaped recovery;
(2) an economy consisting of
- a commerical construction subpart, which is still in sharp decline,
- and consumer related goods and services (residential construction, vehicles, and retail), which are barely growing.
In real terms, profits at America's largest companies are the highest they have even been with the exception of the dot-com and housing bubbles.
In summation, we really do have two separate economies:
(1) an industrial and export economy, which is in a strong, full, V-shaped recovery;
(2) an economy consisting of
- a commerical construction subpart, which is still in sharp decline,
- and consumer related goods and services (residential construction, vehicles, and retail), which are barely growing.
- employment, which even in the industrial sector, is either still declining or just barely growing.
Wall Street and industrial companies are showing near record profits, while employment, wages and salaries for ordinary workers/consumers are totally stagnant or in actual decline.
A bifurcated recovery indeed.
Wall Street and industrial companies are showing near record profits, while employment, wages and salaries for ordinary workers/consumers are totally stagnant or in actual decline.
A bifurcated recovery indeed.


