Friday, September 11, 2009

Some Off-Beat Observations on the State of Things

Herewith just a smattering of items I believe support my case that the third quarter – which may come in at 3% or better – may be a one-hit wonder. I offer these ditties as a counterpoint to recent posts by Bonddad and NDD, both of whom, it should go without saying, I respect and admire. As to the state of the economy and the recovery, it would appear we’ve agreed to disagree, which should at least make for very interesting reading. (I can’t speak for Bonddad or NDD, but it is exceedingly hard for me to find the time to sit down and work on a project like putting together a top-flight post. It is – and always has been – catch as catch can for me.)

Let’s first establish that I know full well that the labor market is a lagging indicator. Having said that, let’s look at some off-the-radar labor metrics that don’t garner a lot of attention.
The Bureau of Labor Statistics (BLS) puts out several reports. One of them – the Job Openings and Labor Turnover Survey (JOLTS) – doesn’t get wide play. In that report, BLS reports on the number of job openings (among other things). If we combine that report with some information from the Current Population Survey (CPS) – specifically the number of unemployed Americans – we can see the following:


Unfortunately, the JOLTS series only goes back ten years, but the picture this paints of slack in the labor market is not a pretty one, with fully six Americans vying for every job opening.

Staying with the JOLTS, let’s have a quick look at the year-over-year (YoY) percent change in job openings:


Some final thoughts on the labor market from economist David Rosenberg:
Yes, initial jobless claims did come down 26k (from yet another upwardly revised figure — the 23rd in a row) to 550k in the September 5th week. But claims are basically range-bound and at 550k are clearly still consistent with net job loss — they need to break below 500k to stop the bleeding in the U.S. labour market altogether and below 400k to start the process of reversing the uptrend in the unemployment rate. At this stage of the 2002 decline in claims from the peak, they were hovering just above 400k, not 550k, and that turned out to be a huge jobless recovery. This will make a mockery out of that one and the prospect that we see the spread between the U6 and the official unemployment rate measures mean revert will imply an unhappy meeting in the middle at around 12%. Just in time for the mid-term elections; tell us that we will not see a U.S. dollar depreciation as the next rabbit out of the hat (a la FDR circa October 1933).

The total level of claimants, including those on extended benefits, soared 158k in the August 22nd week to a fresh all-time high of 9.8 million. Before the onset of the recession in late 2007, that number was hovering around 2.5 million.

Moving on, we learned this week from the Census Bureau that real median household income fell in 2008 to levels we haven’t seen in over a decade:

Of course, that didn’t stop the U.S. consumer, who continued to binge on credit, but I pointed out the other day that the jig is clearly up with regard to borrowed money.
Now, the National Federation of Independent Business (NFIB, “The Voice of Small Business”) takes lots of surveys and polls its members about a host of issues. They publish their results monthly in their Small Business Economic Trends. Let’s have a look at a couple of this month’s entries. It would appear that perhaps a better name for this first item might be the Small Business Pessimism Index Components.


What is the predominant problem that small businesses are facing? Let’s have a look, shall we?

As I mentioned recently, we have been an economy bolstered by government steroids for the past several months. I'm not taking issue with that -- it was clearly the right thing to do -- just stating the fact that we really don't have much clarity as to what the economy would look like absent the government largesse we've seen over the past six months or so. Given what I see in the labor market, the fact that earnings (talking publicly traded companies here) have come almost exclusively from cost-cutting (and virtually no top-line revenue growth), and the fact that small businesses are still hurting badly, I just don't see much more than scraping along the bottom, with a distinct risk of double-dip.

Steppin' Out for Dinner and Wine

- by New Deal democrat

No doggies from me....

The stock market made a new post-crash high this week.

Now comes the weekend. I'll be stepping out for dinner and some nice wine in a little while. Whatever you do, make sure you take time to enjoy yourself!

When Will the Economy start to add Jobs? (I.)

- by New Deal democrat

Now that most economists believe that the economy has ended the recession and entered recovery (defined by GDP terms), the question remains, "when will the economy start to add jobs?" This point was aptly made by Paul Krugman, who last week said on his blog, "the fact that the economy may be technically in recovery is irrelevant" to the vast majority of Americans, for whom the most important metrics by far are jobs and wages.

So, I plan on exploring that question in depth in a few blog posts, because there are a number of data series that do have a history of leading job growth.

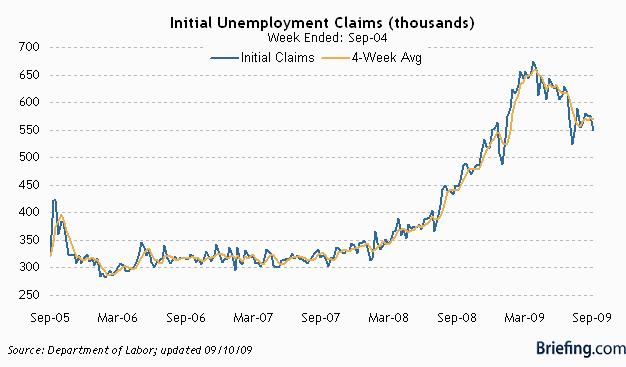
Let's start with initial jobless claims. These are the claims for unemployment benefits by people who have just been laid off. Even in boom times, there might be 325,000 such claims every week. At the height of this recession, in March and April, on average 659,000 claims were being made per week. Recently that number has stabilized in the 550,000-570,000 range, as shown on this graph:


Last week, "only" 550,000 new claims were made -- which was the least number of claims since early January (leaving aside a couple of weeks in mid-July, which may have been affected by an unusual pattern of auto plant closures).

Initial jobless claims are one of the 10 Leading Economic Indicators. Thus they can be expected to lead job growth/loss and also to lead the unemployment rate. A few other bloggers have tried to calculate how much of a fall in initial claims might be needed to generate actual job gains. Berkeley Prof. Brad DeLong believes they must fall under 400,000 per week, basing his opinion on both rising and falling claims for the last two, "jobless" recoveries. Now, much as I esteem the good Professor, in this case the data contradicts him. For example, in both the deep 1974 and 1982 recessions, the economy started to add jobs when jobless claims fell past the 500,000 mark.

Also, there is a big difference between the meaning of the data in rising and falling employment situations. Just this year, in January, when jobless claims exceeded 550,000, that coincided with over 600,000 net jobs lost. Last month, with 570,000 claims a week, the economy shed about 1/3 of that number, 216,000. As Calculated Risk points out, layoffs are only half the story in calculated job growth vs. loss, because we must also know new job hires as well. For example, in a contracting economy, 500,000 job losses a week (or about 2 million a month) might be offset by 1.7 million new hires, for a net loss of -300,000. In an improving economy, those layoffs might be offset by 2.1 million new hires, for a net gain of +100,000 jobs.

Previously I have found that (1) in those recessions and recoveries where jobless claims fell steeply, peak unemployment occurred within 2 months of the point where jobless claims fell 12% from the peak; but (2) in those recessions and recoveries where jobless claims fell slowly, peak unemployment occurred not at the 12% mark, but only when new jobless claims were more than 16% less than peak claims, and stayed more than 16% off for at least 3 months thereafter. Let me show you that in both chart and graph form.

Here's the chart, showing the year, and months from the peak in initial jobless claims that they retreated 12%, 16%, and the month of peak unemployment. In the case of the two "jobless recoveries" I also show the range from peak of initial jobless claims during the time of +GDP with increasing unemployment:

YearMo./-12%Mo./-16%Mo./peak
unemployment
range/
jobless claims
1970-711/71 2/7111/70 n/a
1974-755/75 7/755/75 n/a
19807/80 8/807/80 n/a
198210/82 11/8212/82 n/a
1991-929/91 7/91, 6/926/92 -8% to - 16%
2001-0312/012/02, 6/036/03 -7% to -21%


And here's the graph, showing the percentage drops from each peak in jobless claims until a point 3 months after unemployment peaked, for the 1982,1991, and 2001 recessions as well as the present:


Based on that work, I believe that the economy will start to add jobs when the initial jobless claims rate drops past 550,000, and stays significantly under that number (about 530,000 or less) for three months, or else quickly drops under 500,000.

But of course, that begs the next question, which is, how can we tell if jobless claims are moving in that direction or not? There are several other data sets that help pinpoint this, and that's what I'll explore next week.

Consumer Confidence Up, Wholesale Inventories Down

- by New Deal democrat

This morning brings us two more bits of news that coincide with the story of incipient Recovery.

The University of Michigan consumer confidence index rose to 70.2, and expectations to 69.2, both of which are the second highest readings all year (June was slightly higher).

Meanwhile, the Census Bureau reported that wholesale sales rose +0.5% in July, while inventories fell -1.4%, meaning that the July inventories/sales ratio for merchant wholesalers declined to 1.23.

At the height of the expansion, this ratio was 1.12. It collapsed to 1.35 by January during the economic free-fall. More importantly, tighter inventories ultimately lead to hiring in manufacturing, and this ratio is right where it was in 2002 and early 2003 just before jobs started to increase in the last Recovery.

Bonddad Is On Vacation

As of today I am formally on vacation. I will be returning Monday, September 21. Until then, Invictus and New Deal Democrat will be providing content.

See you then.

Thursday, September 10, 2009

Battle Lines Bein' Drawn

Nobody's right if everybody's wrong.

I see that among our happy trio it's two against one. I like my odds. Game on.

Today's Markets


The SPYs moved higher today -- again, breaking through upside resistance. Also note the MACD is about to give a buy signal. In addition,


The transports are confirming the move higher, as are


The QQQQs.

In Response to Invictus' Concerns About the Consumer

There are several reasons why I asked Invictus to write here. First, he is a good friend who is very knowledgeable about the economy. For example, he actually knows there are several employment reports and is thoroughly versed on the strengths and weaknesses of each placing him light years ahead of most internet economists. Secondly, he writes exceedingly well. And third, he provides much needed balance to my bullishness.

Yesterday he wrote an article titled Not Yet Ready to Party where he expressed his concerns about future growth. His argument centers on the US consumer. Essentially, he is concerned that the percentage of growth attributable to consumer spending will decrease as a percentage of the US economy. He argues that the instead of accounting for approximately 71% of GDP growth, PCEs will revert to their historical median 65%. The decrease will be caused by a return to frugality -- consumers will simply stop spending in response to a poor labor market and to pay down their high level of current debt. As a result, GDP growth will be slow or non-existent.

My view is different. First, while I agree the consumer will be more frugal, I don't believe the frugality will lead to a decrease in consumer spending but a slower pace of consumer spending growth. This is due to a change in the way the consumer shops. Consider this exchange in the latest Barron's with a retail sales analyst:

What are some of the big trends you're seeing in retailing right now?

The consumer has definitely stabilized, and we have achieved this idea of a new normal. So consumers are still clipping coupons. They're still trading down to private labels. On the luxury side, fashion isn't selling as well. The consumer is willing to invest in something if she can use it for a long time. But if it is just fashion, it is only going to be in style for a season or two. Everyone faced a different kind of financial crisis in 2008. At the low end, the dollar stores have done very well. So your average household has probably shopped more at the dollar stores.

To me, the most interesting change has been the big move to eating at home. We were starting to see that trend in 2007 with higher gas prices. Then, when the recession hit, that accelerated significantly. So anyone who can sell food has seen a significant uptick in traffic, starting in 2008, although the amount spent hasn't necessarily responded because of the trade-down to private-label goods, where prices are cheaper. For a while, you were seeing an increase in sales of prepared foods. But once again, as the consumer really hunkered down, you saw a significant increase in the sales of scratch baking products. So consumers were buying food processors, pots and pans -- items they didn't have because they ate out so much. Consumers are spending where they see value, though different consumers define value differently.

How else have consumers' habits changed?

The consumer isn't thinking, "Do I spend it here or there?" Now it's, "Do I spend it or save it?" A lot of retailers are worried about the consumer's appetite for credit. People don't want to leverage up again, and they want to feel that they can manage within a budget. Some retailers are saying that the consumer isn't putting that extra item in the basket. And so even if it was a low-priced item, units per transaction are down.


I also believe this analysis (also from Barron's) of the coming consumer is correct:

AMERICA'S FLING WITH BLING MAY BE OVER, but the shift to thrift -- brought on by a sagging economy and stock market, and heralded on the cover of Time -- also has gone too far. According to Gallup, the polling organization, Americans cut their daily expenditures by more than 40% in the past year. That's not just fewer lattes; it's muscle and bone.

As savings rise and the market rallies, however, a new consumer is emerging, seeking a sensible middle ground between the gross excesses of the mid-2000s and the privations of the past year. He -- and more often, she -- is likely to find it in companies that offer great products, excellent service and outstanding value, which, by the way, doesn't always mean the lowest price.


As a result, I think consumer spending will contribute to growth but at a slower rate.

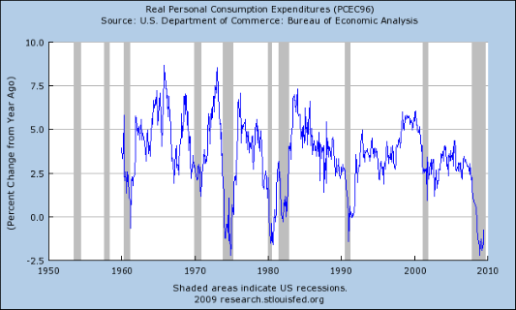
Regarding the actual pace of personal consumption expenditures, here is a chart of the year over year percentage change in real personal consumption expenditures:


Notice that during the most recent expansions there has been a sweet spot of year over year percentage change between 2.5% an 5%. Interestingly enough that number has never consistently been between 0% and 2.5% during an expansion. Yet there is nothing that says the year over year percentage change can't be at that level; it just never has.

Here is a chart of the quarter to quarter percentage change of personal consumption expenditures that goes back to 1990:


The median quarterly change in PCEs for this period was 3.2%. Notice how in the last two expansions the quarter to quarter PCE percentage change ranged from (in general) 2% to 4%. There is nothing indicating that rate of change couldn't be between 0% and 2%.

Therefore, while the consumer will not spend like he used to, the practical side of the equation means the consumer will eventually be forced to spend on items. This leads to the following conclusions:

1.) The consumer's situation (high levels of debt) and the economic situation (higher unemployment) will lead to lower consumption expenditures.

2.) The consumer will extend the life of most durable goods (cars and major appliances) by spending on parts and service. This will add to economic growth, but at a slower pace

3.) While the consumer will be spending less on items, when he does spend he will want more for his money. Instead of walking into a store, purchasing an item and leaving, the consumer will do more up-front research into items and want more service when he does purchase.

4.) The current drop in consumer spending is very much a by-product of low consumer confidence brought on by the worst recession of the last 60 years. As the economy emerges from this, consumer confidence will rise and spending will increase. However, spending will not increase to previous levels. Instead, we can expect the consumer to increase his personal consumption expenditures in the 0%-2% range of quarter to quarter growth.

The next question is where will the money come from. The first answer to that is that while income has been dropping, it appears to be stabilizing. Here is a chart of the last 6 months of total wages and salary disbursements.


Notice that over the last 4 months, this number as stabilized in a range between $6.441 billion and $6.213 billion. In other words, this number appears to the stabilizing. In addition,


Real disposable income has actually been increasing. A large reason for this increase is an increase in government transfer payments which in turn have gone to increased savings. However, the point is the money is available for increased consumption when consumer sentiment picks-up to a point where it can increase.

The above points come from an article I wrote titled the Fits and Starts Recovery where I outlined where I see growth coming from for the next 12-18 months.

Only time will tell who is right -- or if either of us is right. However, I welcome Invictus' insights and am pleased to have him aboard.

Getting it wrong about Consumer Credit

- by New Deal democrat

Apparently, the curse of my blogging life is the sisyphian task of debunking the use of lagging indicators to forecast the future.

One of the gloomy meme's du jour for the last few days has been how the record year-over-year post-WW2 drop in consumer credit presages worse times ahead. Just for example, here's Mike Shedlock:

Today, consumer credit contracted at a pace that is shockingly twice as bad as March, even though the March contraction was the biggest drop since 1990....

Looking ahead, Christmas season is likely to be miserable with poor sales, poor margins, more store closings, and more bankruptcies. Consumers are increasingly going to be asking "Do I really need this" as well as "Can I really afford this?" Increasingly, the answer is going to be no.


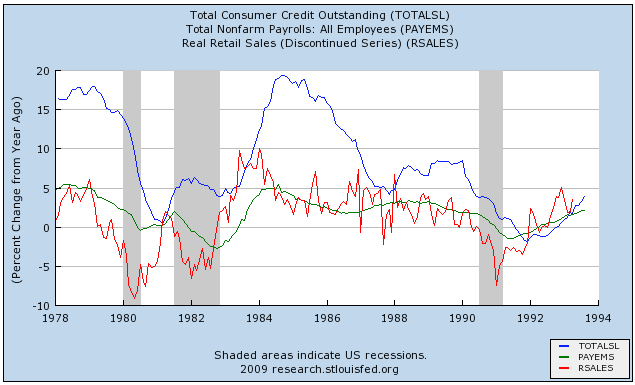
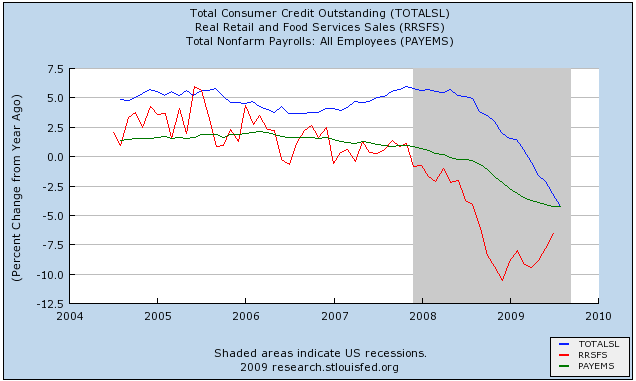
There's just one small problem with that analysis. Consumer credit is a totally reliable lagging indicator. Here's a couple of graphs showing the relationship among 3 data series: real retail sales (red), jobs (green), and consumer credit (blue). I have graphed in year-over-year terms to better show the trend, so this is the "first derivative" of the "real" numbers -- but the general relationship holds for the "actual" numbers as well. Notice the order in which each series turns.

Here's the 1980s and 1991 recessions:


and here is the current "Great Recession":


The order is unmistakably clear (and it goes back as far as the data has been kept);

1. First, real retail sales turn (red).

2. Then, jobs turn (green).

3. Finally, about a year after real retail sales turn, consumer credit turns (blue).

Real retail sales turned in December 2008.

Jobs are turning now.

Consumer credit will probably turn in about December.

So, Mish is projecting a lagging indicator to predict what a leading indicator will show in four months. To the contrary -- granted this is a really low-expectations comparison -- it appears far more likely than not that this year's holiday sales will be better than last year's.

Unemployment Claims Drop

From the DOL:

In the week ending Sept. 5, the advance figure for seasonally adjusted initial claims was 550,000, a decrease of 26,000 from the previous week's revised figure of 576,000. The 4-week moving average was 570,000, a decrease of 2,750 from the previous week's revised average of 572,750.


In other words, we have more improvement in the labor market.

Here is the chart, with the 4-week moving average.

In In-Depth Look At the Fed's Beige Book

About every six weeks the Federal Reserve issues the Beige Book. This is anecdotal information collected from each Federal Reserve district. It provides a good overview of the current situation in the economy. Let's take a look at what the report says.

Residential real estate markets remained weak, but signs of improvement continued to be noted. Chicago, Richmond, Boston, and San Francisco observed an uptick in sales over the last six weeks, while sales in the Philadelphia District were described as steady. St. Louis commented that residential home sales had not improved. Most Districts reported that sales remained below the levels of a year earlier. However, Atlanta, New York, Cleveland, and Minneapolis documented some year-over-year gains in select markets. Most Districts noted that demand remained stronger at the low-end of the housing market. Boston, Cleveland, Dallas, Kansas City, Richmond, and New York indicated that the first-time home buyer tax incentive was spurring sales. However, Philadelphia did note an upturn in sales at the high-end of the market. Reports on house prices generally indicated ongoing downward pressures, although Dallas and New York noted some increases. Construction remained at low levels overall, although Chicago and Dallas reported a small increase in activity.


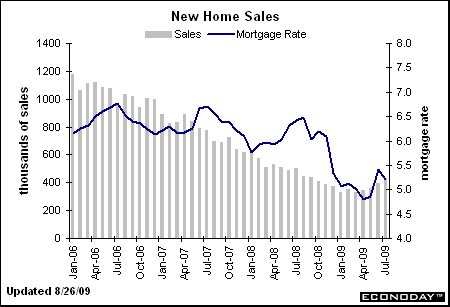
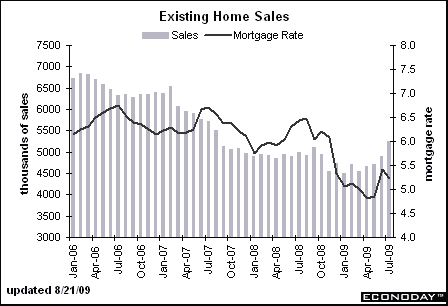
The points made are consistent with the following charts of homes sales.


New homes sales have bottomed and are showing a slight increase.


Existing home sales increased at a good rate last month.

While we are still seeing a year over year decline in housing prices, we are starting to see month to month improvement:

The prices of single-family homes in 20 major cities rose a not-seasonally adjusted 1.4% in June, the second increase in a row after falling every month for three years, according to the Case-Shiller home-price index released Tuesday by Standard & Poor's.


Commercial real estate is still having problems:

Reports on commercial real estate markets indicated that demand for space remained weak and that construction continued to decline in all Districts. Atlanta, Philadelphia, Richmond, and San Francisco reported that vacancy rates increased, while rates held steady in the Boston and Kansas City Districts and were mixed in New York. Boston, Dallas, Kansas City, Philadelphia, and Richmond commented that the demand for space remained weak. Commercial rents declined according to Boston, Chicago, New York, Philadelphia, and Richmond. Rent concessions were reported in the Richmond and San Francisco markets, and Richmond noted that some landlords had postponed property improvements in an effort to conserve cash. Construction remained at very low levels, with modest improvements noted in public construction in the Chicago, Cleveland, and Minneapolis Districts.


There's been a great deal written about the impending commercial real estate collapse. However, a closer look at the data indicates the word collapse is a bit far-fetched:

U.S. banks have been charging off soured commercial mortgages at the fastest pace in nearly 20 years, according to an analysis by The Wall Street Journal. At that rate, losses on loans used to finance offices, shopping malls, hotels, apartments and other commercial property could reach about $30 billion by the end of 2009.

The losses by regional banks on their commercial real-estate loans will be among the most watched details as thousands of banks report second-quarter results over the next two weeks. Many of the most troubled banks have heavy exposure to commercial real estate. So far, 57 banks have failed this year.

The $30 billion estimate is based on financial reports filed by more than 8,000 banks for the first quarter. The trend continued as a handful of major banks reported second-quarter results, including Goldman Sachs Group Inc., J.P. Morgan Chase & Co. and Bank of America Corp. Regional banks tend to have higher exposure to commercial real estate than these big financial institutions.


While $30 billion is not good, it is hardly a fact on which to make calls for an apocalypse. In short, the market should be able to handle that. While other estimates place the total losses higher (at a maximum rate of $150 billion) it's still not a a level where we should be making doomsday predictions. And while there is also trouble in commercial mortgaged baceked securities, the concern is over roughly $100 billion in total problem loans that will come due and have to be refinanced by 2012. That means the loans will have to be dealt with over a period of 2-3 years. While the development is not good and should not be applauded, this is a manageable disaster.

Most Districts reported modest improvements in the manufacturing sector. Philadelphia, Richmond, Atlanta, Cleveland, and Chicago all reported slight-to-moderate increases in new orders. San Francisco indicated that new orders increased for manufacturers of semiconductors and other IT products, while orders declined for metal fabricators and petroleum refineries. Dallas noted that orders held steady, while St. Louis reported that manufacturing output continued to decline, but at a slower pace. Richmond, Atlanta, Chicago, and Minneapolis reported increases or planned increases in automobile and automobile-related production. Several Districts also noted increased production in the pharmaceutical industry.


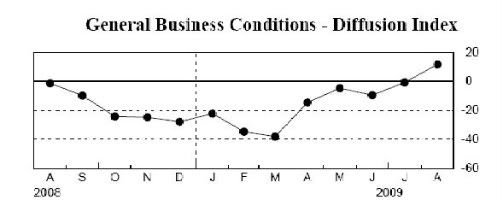
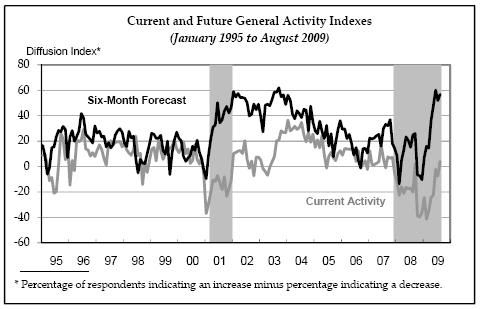
This has been a surprisingly uncovered series of stories. Consider these charts of the various Federal Reserve district's manufacturing surveys:


The Empire State index (NY) has been increasing for several months and is now above 50.


The Philly Fed index is right about expansion levels, as is


The Richmond Fed's numbers.


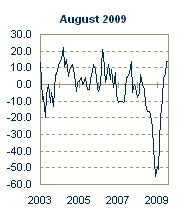
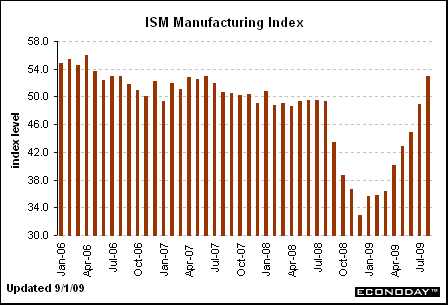
And the national ISM number is now above 50, indicating expansion in the manufacturing sector. Overall, manufacturing is showing clear signs of pulling out of the recession.

Labor market conditions remained weak across all Districts, but several also noted an uptick in temporary hiring and a decline in the pace of layoffs. Richmond reported that most service-providing firms continued to cut employees, while Minneapolis and New York noted additional layoffs in the manufacturing sector. Cleveland reported modest job declines in the banking, commercial construction, and coal mining sectors. Further job cuts are expected in auto manufacturing according to St. Louis, and Dallas indicated further staff reductions are anticipated in the airline, energy, and residential construction sectors. Staffing firms in a majority of Districts reported a modest increase in the demand for temporary workers, although industry contacts in Boston also questioned whether these gains will persist. New York cited a modest pickup in temporary hiring for the legal and financial industries. Chicago noted an uptick in demand for workers in the healthcare and information technology industries. St. Louis and Minneapolis reported that federal stimulus funds have had a positive impact on construction and local government jobs.


I analyzed the latest jobs report here. Here is a list of the conclusions from the article:

1.) The rate of job destruction has decreased since the beginning of the year. Remember that at the end of last year the beginning of this year, the economy was losing 600,000 jobs per month. To expect that figure to turn around and print a positive number within 6-9 months is highly unrealistic. In fact, it is most possible that we'll see job losses through the next 3-6 months. But the pace of job losses is decreasing which is good news.

2.) The increase in the unemployment rate is bad news, plain and simple.

3.) The steady size of the number of people working part-time for economic reasons along with the possible topping out of discouraged workers is also good news as it indicates a possible topping of two categories of labor under-utilization.

4.) Two of the four time periods of unemployment showed improvement last month and the worst category (people unemployed for 27 weeks and longer) showed a far slower rate of acceleration.

5.) The increase in the marginally attached and the number of people unemployed for 5-14 weeks are bad developments.


There is one important point with the unemployment rate: it is a lagging indicator. History shows us that on a year over year basis, GDP must turn positive before we can even think about a decline in the unemployment rate. As such, we're simply not in a position to be talking about a drop in the unemployment rate yet.

Consumer spending remained soft in most Districts. The majority of Districts reported that retail activity was flat. Boston, Philadelphia, and Kansas City noted improvement in sales, but attributed the increase primarily to back-to-school purchases. Philadelphia, Chicago, Cleveland, and San Francisco observed that shoppers remained focused on essentials and continued to refrain from purchasing discretionary and big-ticket items. Kansas City and San Francisco noted weak restaurant sales. Richmond, Philadelphia, Chicago, Atlanta, and Boston remarked that retailer inventories were being closely monitored and were keeping them in line with low sales levels.


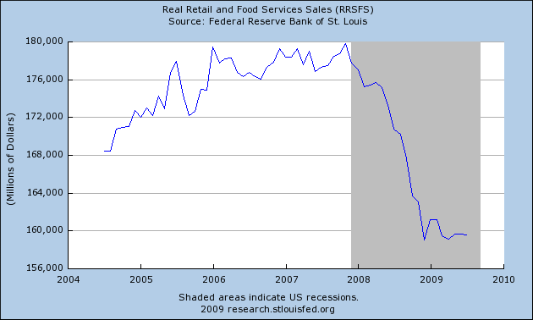
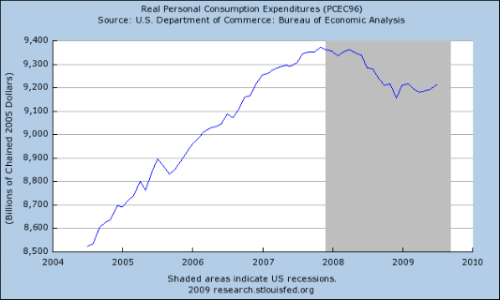
While spending is soft, it has stabilized as these two charts demonstrate:


Real (inflation-adjusted) retail sales have bottomed, as have


Real personal consumption expenditures.

Let's review:

1.) Housing sales have stabilized.

2.) Housing prices are still declining on a year over year basis, but have shown improvement over the last two months.

3.) The talk of a commercial real estate "implosion" is a bit far-fetched. There are problems but they are manageable.

4.) Manufacturing is now expanding.

5.) The labor market is still weak, but the rate of job loss continues to decrease and metrics within the jobs report (the number of people unemployed for specific lengths of time) is showing improvement. The latest Beige Book mentions in several places of an uptick in temporary help. Finally, the unemployment rate is a lagging indicator; it is unrealistic to talk of an improvement in the unemployment rate when GDP is still contracting.

6.) Consumer spending has bottomed.

Thursday Oil Market Round-Up


The main question on the weekly chart remains whether or not oil is forming a double top. Note the RSI has printed a lower top on the second price, indicating a technically weaker price. In addition we have the seasonality factor - the US driving season is over. However, also note the 10 and 20 week EMAs are still moving higher and that the 10 week EMA has already moved above the 50 week EMA.


The daily chart adds a great deal of weight to the double top thesis. First, the second top had a much lower MACD and RSI reading. In addition, prices have already broken the uptrend that started in late April. Also note that over the last week oil has printed some very weak candles -- indicating a lack of conviction on the part of traders.

Wednesday, September 9, 2009

Not Yet Ready to Party

"The fact that the economy may be technically in recovery is irrelevant." -- Paul Krugman, on his blog, Sept. 4, talking about the importance of the labor market.


Now me, I'm not even sure that we're in a recovery yet. We've had massive government incursion into both the financial sector and the automotive sector. We're being propped up by the spring's stimulus package. In a nutshell, it's virtually impossible to determine where the economy would be left to its own devices. We may be out of intensive care, but we've still got tubes running every which way and require a room near the nurses' station. Sadly, the one sector of the economy that the federal government has relatively little influence on is the labor market, which continues to bleed jobs (yes, yes, at a slower rate than last winter).

Unemployment claims seem stuck in mid-500k range, and it's a sure bet the unemployment rate will head somewhat higher before topping out.

Sure, ISM printed above 50, but is it sustainable and how many people did last month's print put to work? What is going to be the driver that turns the labor market around?


Let's talk a little mean reversion:


We know that Personal Consumption Expenditures (PCE) rose to roughly 71 percent of our $14 trillion GDP. The mean is around 65 percent. If PCE simply reverts to the mean, that would imply a loss of about $850 billion of GDP that needs to be "made up for" elsewhere. Anyone? Bueller? Exports? What?


Consumer credit is in absolute implosion mode -- it dropped month-to-month by $21 billion, and year-over-year has dropped well over $100 billion. Behold:


In short, it's almost laughable to talk about the banks' supposed unwillingness to lend -- it appears no one wants their money in any event.


The U.S. Homeownership Rate is still too high:


Consumers are still over-burdened with debt:


Credit was to the last expansion as steriods were to baseball during the home run bonanza that lasted until the league cracked down. I actually looked at the At-Bats/Home Run for players like McGwire, Bonds, and others. It was remarkable how the number dropped during the period they were suspected of (or actually were) using banned substances. That metric floated right back up once they were off the juice. In short, steroids and HGH turned superior players into almost superhuman athletes. Once ridded of the Bruce Banner-like gamma radiation, they came back down to earth. Similarly, our extraordinary economy got artificially pumped up by credit, and we are only now coming off that high. However, unless/until we find another way to get our fix, the road to recovery is going to be subpar at best (but we'll be economically healthier in the long run).


I have focused almost exclusively on the consumer in most of what I write, for the simple reason that I think no recovery will have any sustainability without the consumer on board. On that point, I would note that the Fed's Flow of Funds Report -- one of my favorites, along with CFNAI -- comes out next week. It is always a fascinating report chock full of all manner of goodies.


So, that's where I'm at. Not yet ready to break out the bubbly.

Today's Markets


Click for a larger image

The main issue with the SPYs is their sell-off to the 61.8% Fibonacci level. It never ceases to amaze me how important those numbers are.


Click for a larger image

The daily chart shows the SPYs are in a rally, but the bars are pretty weak. Ideally we would like long and strong candles -- that is, candles that are tall mostly filled. That would indicate prices opened low and closed high and probably maintained that momentum throughout the day. The bars on the chart are a lot weaker and just don't inspire a lot of confidence.

Beige Book Sees A Steadying Economy

From the Federal Reserve:

Reports from the 12 Federal Reserve Districts indicate that economic activity continued to stabilize in July and August. Relative to the last report, Dallas indicated that economic activity had firmed, while Boston, Cleveland, Philadelphia, Richmond, and San Francisco mentioned signs of improvement. Atlanta, Chicago, Kansas City, Minneapolis, and New York generally described economic activity as stable or showing signs of stabilization; St. Louis remarked that the pace of decline appeared to be moderating. Most Districts noted that the outlook for economic activity among their business contacts remained cautiously positive.


I'll have more on this tomorrow. The short version is this adds more evidence to the thesis that the recession is over.

Getting it wrong about temporary help

- by New Deal democrat

An article by William Hester, and analyst with Huffman Research, has gotten a lot of play yesterday and today, for example at Bloomberg and also at The Big Picture, chiefly for his claim that “temporary hiring is an exception, and has continued to deteriorate” rather than getting “less bad”, and that therefore this means a jobs recovery is apparently far off. He says:


temporary hiring is a reliable leading indicator of nonfarm payrolls....

At the beginning of this decade, temporary hiring turned down in April of 2000, eleven months before the 2001 recession began. After the economy weakened, it would end up putting in a double bottom. The first time temporary hiring bottomed was in December 2001, just one month after that year's recession ended. It rose modestly, as the overall jobless recovery began. Interestingly, it turned down again and bottomed in April of 2003, a month after that year's bottom in the stock market. Following the most recent economic expansion, temporary employment peaked in December 2006, a year before the start of the current recession. It's fallen for 20 consecutive months through August, failing to reflect the recent strength in the stock market.

Temporary hiring will almost surely bottom prior to overall employment in this cycle.


There’s no very polite way to put this: he’s simply wrong.

Temporary jobs data has only been collected since 1990 (that's exactly 2 recession bottoms). Did you notice Hester mention that bottom? No, he didn’t. That would be, because both temporary help and total nonfarm payrolls bottomed in the exact same month: May 1990! The only other post-recession bottom in temporary hiring, in April 2003, coincided with the second lowest total nonfarm payrolls number, a whopping 0.02% (that’s 2/10,000’s) higher than the absolute bottom 4 months later in August.

Some “reliable leading indicator,” huh?

And as to his other claim, that temporary jobs data continues to deteriorate at a worse rate, here’s the raw numbers for 2009:
January -89.9
February -73.0
March -57.3
April -53.9
May -0.9
June -29.7
July -7.6(P)
August -6.5(P)

Apparently, continuing to deteriorate at a worse rate includes a loss of only 1/15 of that earlier this year.

So, the real takeaway from Hester’s analysis of temporary help is that we shouldn’t expect total employment to pick up – at least until next month.

May I please have his job? It must be nice to get paid well for being wrong, as opposed to blogging for free.

The New US Consumer

From this week's Barron's:

What are some of the big trends you're seeing in retailing right now?

The consumer has definitely stabilized, and we have achieved this idea of a new normal. So consumers are still clipping coupons. They're still trading down to private labels. On the luxury side, fashion isn't selling as well. The consumer is willing to invest in something if she can use it for a long time. But if it is just fashion, it is only going to be in style for a season or two. Everyone faced a different kind of financial crisis in 2008. At the low end, the dollar stores have done very well. So your average household has probably shopped more at the dollar stores.

To me, the most interesting change has been the big move to eating at home. We were starting to see that trend in 2007 with higher gas prices. Then, when the recession hit, that accelerated significantly. So anyone who can sell food has seen a significant uptick in traffic, starting in 2008, although the amount spent hasn't necessarily responded because of the trade-down to private-label goods, where prices are cheaper. For a while, you were seeing an increase in sales of prepared foods. But once again, as the consumer really hunkered down, you saw a significant increase in the sales of scratch baking products. So consumers were buying food processors, pots and pans -- items they didn't have because they ate out so much. Consumers are spending where they see value, though different consumers define value differently.

How else have consumers' habits changed?

The consumer isn't thinking, "Do I spend it here or there?" Now it's, "Do I spend it or save it?" A lot of retailers are worried about the consumer's appetite for credit. People don't want to leverage up again, and they want to feel that they can manage within a budget. Some retailers are saying that the consumer isn't putting that extra item in the basket. And so even if it was a low-priced item, units per transaction are down.

Wednesday Commodities Round-Up

Consider the following two images (click for a larger image):


On the weekly chart, notice we're at the tail end of a head and shoulders pattern.


From The Smart Money Tracker:

Obviously $1000 is a big psychological number and most investors are concentrating on a breakout of that level as a sign the secular bull market is still intact. However $1000 isn't the important level. The important breakout has already occurred when gold took out the 1980 highs of $850.

W.D. Gann noted that the size of the consolidation often signals how large the ensuing rally will be once an asset breaks out of that consolidation.

The 28 year consolidation in gold is foretelling a bull market rally like no other that any of us have ever seen.

Treasury Tuesday's

Actually, I'm a day behind thanks to the long weekend. I'll post the commodities charts later today.


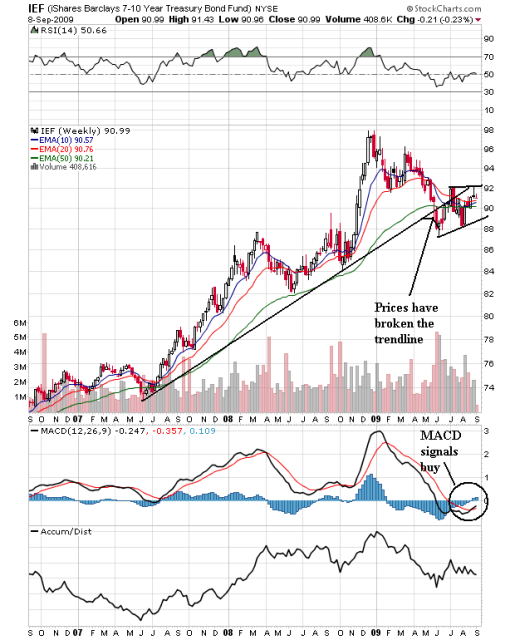
There are two important points on the weekly chart. First, prices have broken an upward sloping trend line that started in mid-2007. This is actually a health development as it indicates money is moving from the safety of the Treasury market to more risk oriented assets. In other words, traders are now more comfortable taking risk which occurs in an economic expansion. Secondly, notice that prices are still above prices that occurred in 2008. This tells us prices ultimately have a ways to move lower.


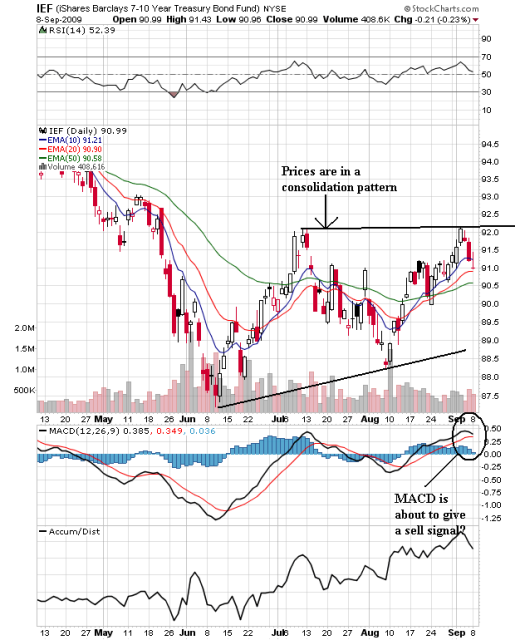
The daily chart shows that prices are in a consolidation pattern, fluctuating between 87.5 and 92. The MACD is about to give a sell signal -- which is in direct contrast to the MACD on the monthly chart which has given a buy signal.

Tuesday, September 8, 2009

Today's Markets


Click for a larger image

after opening higher, prices traded in a pretty narrow range of roughly 60 cents. Starting right after noon, prices used the SMAs for technical support. There was a big volume surge at the end, but it didn't move anywhere.