- by New Deal democrat
All of the remaining 2023 data - housing sales and construction, and personal income and spending, as well as the Index of Leading Indicators - will be reported this week. After Christmas, only initial claims will be reported next week.
There are a variety of economic data series to track both average and median wages:
- 1. The most commonly known measure is that of average hourly pay for nonsupervisory workers, which is part of the monthly jobs report.
- 2. The Bureau of Labor Statistics, which conducts the household employment survey, also reports "usual weekly earnings" for full-time workers each quarter.
- 3. The BLS also measures the Employment Cost Index quarterly.
- 4. The BLS also measures "business sector real compensation per hour" quarterly.
Below are all 4, normed to 100 as of Q4 2019, the quarter before the pandemic hit, updated through Q3 of this year:
To cut to the chase, all of them except for the Employment Cost Index for wages, show increases since before the pandemic. Real average hourly earnings through September were up 2.7%, real hourly compensation for workers was up 2.3%, and real usual weekly earnings were up 0.8%. The employment cost index for wages, however, decreased -1.2%.
Normally this would be of some concern, because the employment cost index is designed to measured changes in wages for the same job, i.e., it adjusts for differences in the number of people employed in various sectors. And indeed, when we take out inflation and measure the quarterly *nominal* percent change in each index, only the employment cost index rose during the 2020 shutdowns, indicating that once we take out compositional changes in the labor force, wages continued to rise slightly:
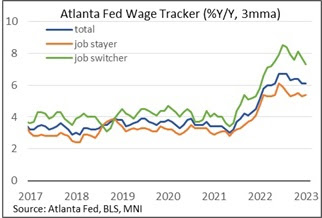
Just as significantly, though, note that the point where the employment cost index did not rise nearly as much as the others was during the 2021 jobs boom. Most likely what has happened is that the E.C.I., because of its composition, did not pick up the difference in wage gains between “job switchers” and “job stayers,” where the former have gotten much bigger wage increases than the latter:
And with the extremely tight labor market of the last several years, there have been a record number of job switchers, as we know from the monthly voluntary “Quits” data in the JOLTS survey:
To answer that, let’s take a look at the longer term trend in all 4 measures going back to the end of the Great Recession in 2009:
Real wages by all measures declined for several years into the recovery, even though the unemployment rate was decreasing, before picking up and continuing to increase for the rest of the expansion.
The answer to that, in turn, can be found by looking at the YoY% change in the inflation rate (blue in the graph below, right scale) and in particular picking out the change in gas prices (red, left scale):
At the bottom of the Great Recession, gas prices got as low as $1.60/gallon. As the economy began to expand, they rapidly recovered to $4/gallon, giving rise to what I called the “oil choke collar” restraining economic growth. Similarly, after the pandemic, and especially with Russia’s invasion of Ukraine, gas prices, as well as the big 2021 springtime stimulus spending spree, helped drive inflation sharply higher. It took a while for wages to catch up.
So the verdict is: yes, real wages have increased since before the recession. But a necessary part of that increase has been the massive switching of jobs from lower to higher paying positions by workers who, for once, had leverage.


