- by New Deal democrat
Over the past few months, one of my repeated refrains has been that a sharp deceleration beginning with the consumer sector of the economy is more likely than not. In December, that showed up in spades in retail sales, although that was clearly influenced by people front-loading Christmas purchases into October and November.
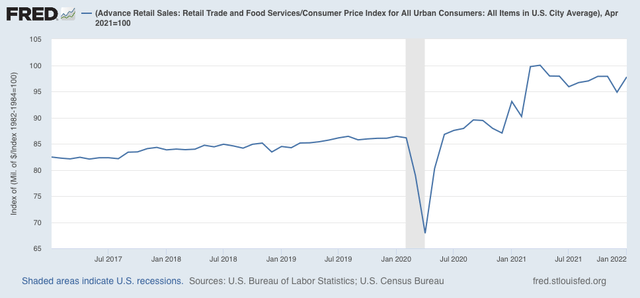
This month it completely reversed. Retail sales, one of my favorite “real” economic indicators, rose sharply in January, up +3.8% for the month before inflation. After inflation, “real” retail sales were still up +3.1% for the month, although they are still down -2.2% from last April’s peak:
On a YoY basis, real sales are up 5.4%. This is the lowest comparison since last February, but still a very good number over the long term:
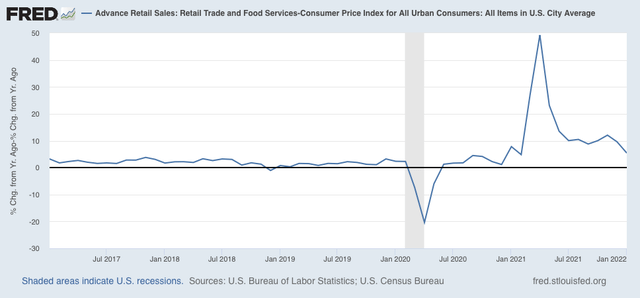
Note that these comparisons almost certainly will turn negative in March. Probably more important is that, as shown in the first graph above, they have been esssentially flat since last April. That’s not recessionary, but it’s not good either.
In short, this report remains consistent with a slowdown in the consumer sector of the economy.
Next, let’s turn to employment, because real retail sales are also a good short leading indicator for jobs.
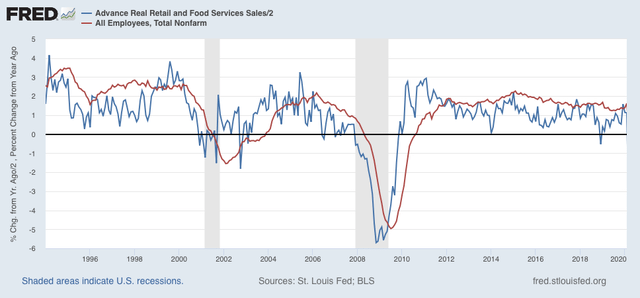
As I have written many times over the past 10+ years, real retail sales YoY/2 has a good record of leading jobs YoY with a lead time of about 3 to 6 months. That’s because demand for goods and services leads for the need to hire employees to fill that demand. The exceptions have been right after the 2001 and 2008 recessions, when it took jobs longer to catch up, as shown in the graph below, which takes us up to February 2020:
Now here is the same graph since just before the pandemic hit:
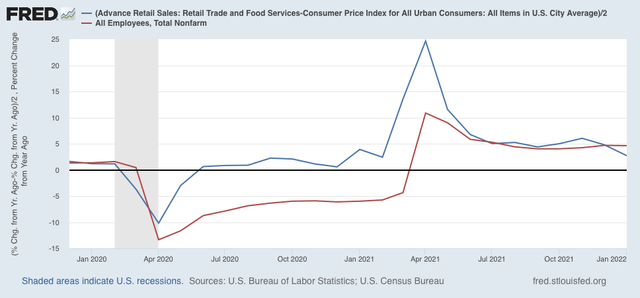
The two had been right in line during the latter half of 2021. With real retail sales slowing down considerably in the last two months - and with the expectation that they will go negative for at least a couple of months in March and April - I expect the string of monthly jobs reports averaging 500,000 or more will shortly end, although maybe not for several more months. Whether we get a negative print at some point in spring or early summer will depend on whether sales, measured from last April, continue to go sideways, improve, or deteriorate.
Finally, real retail sales per capita is one of my long leading indicators. Here’s what it looks like for the past 30 years:
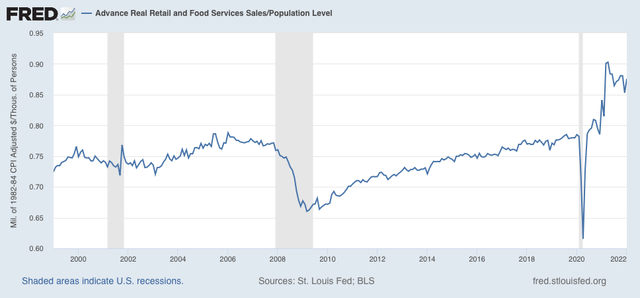
With a -3.0% decline since April, this remains a negative signal, and reinforces the long leading forecast of a stall or near-stall in the economy by about the end of this year.
—-
Let’s also take a look at this morning’s report on January industrial production. This was also positive, as total production increased 1.4%. However, the big increases were in utilities and secondarily in mining. Manufacturing production only increased 0.2%. Here are the index values for the past 5 years:
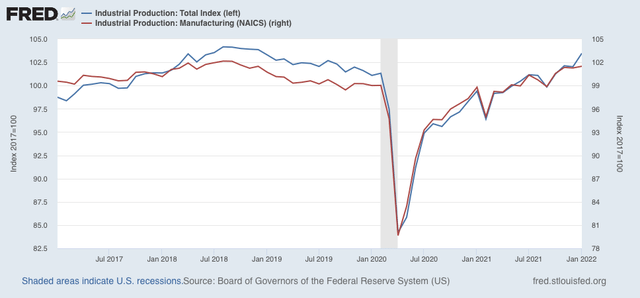
Both are significantly higher than they were just before the pandemic, but slightly below their 2018 peaks. The YoY% comparison shows a slight deceleration trend:
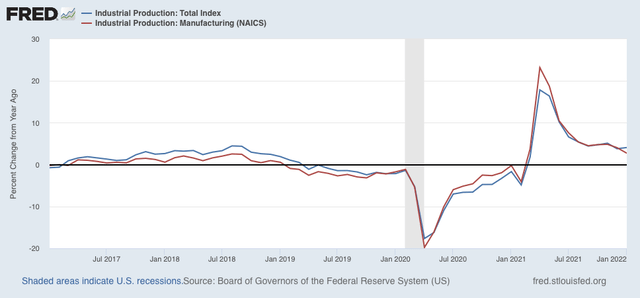
Industrial production is the pre-eminent coincident indicator, telling us that at present the economy is performing fairly well.