- by New Deal democrat
No economic data releases today, but a little kerfluffle in the markets.
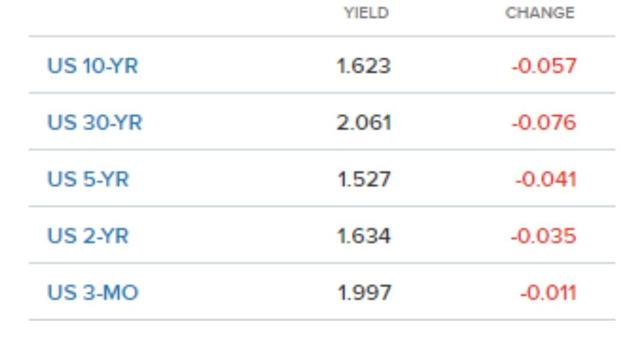
First of all, in case you missed it, the 10 year to 2 year bond spread briefly inverted early this morning. Here’s the screenshot from CNBC:
As I say, it was brief. As I type this, the spread has reverted to normal.
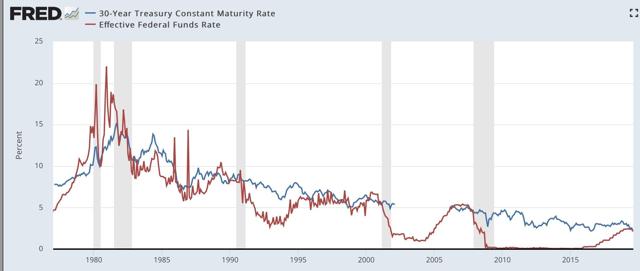
But another significant spread inverted yesterday, and has remained inverted today: the 30 year bond vs. the Fed funds rate. The Fed funds rate is currently at 2.12%, and beginning yesterday afternoon, the 30 year bond yield went lower than that. As I type this, the long bond is yielding 2.05%, an all-time low. Here’s the lifetime chart:
As a caution, note that this spread also inverted for a few days several times in the mid-1980s and mid-1990s, as well as for a month and a half in 1998, without signaling recession. Most importantly, the Fed acted swiftly in 1998 to cut rates.
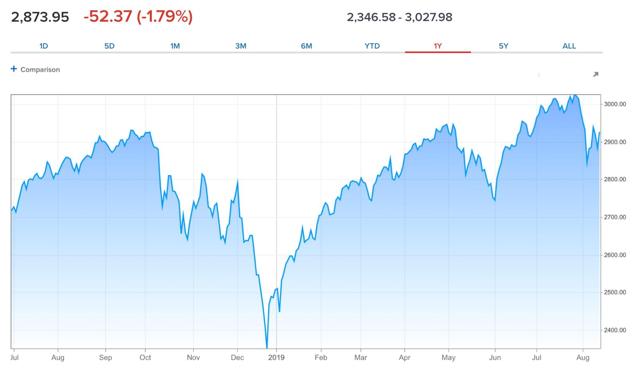
As it did last December when the first portions of the yield curve inverted (in the 2 to 5 year range), the stock market is taking this badly:
The stock market is up over 20% since that bottom.
Here is my takeaway from this morning:
1. The more portions of the bond yield curve invert, the stronger the negative signal.
2. BUT, we still have the counter-examples of 1966 and 1998, where the inversions were met with fiscal stimulus (1966) or prompt interest rate cuts (1998) and no recession occurred.
3. Even if the yield curve is signaling a recession in the near future, it doesn’t mean there is one arriving imminently. A strong stock market sell-off like December’s would be an overreaction.
4. If the further yield curve inversions mean a recession this coming winter, we ought to be seeing signs of either consumer weakness in retail sales (reported tomorrow) or corporate profits (reported for Q2 in two weeks in the revised GDP report).
I plan on doing a more detailed look at the consumer tomorrow after retail sales for July come out.


