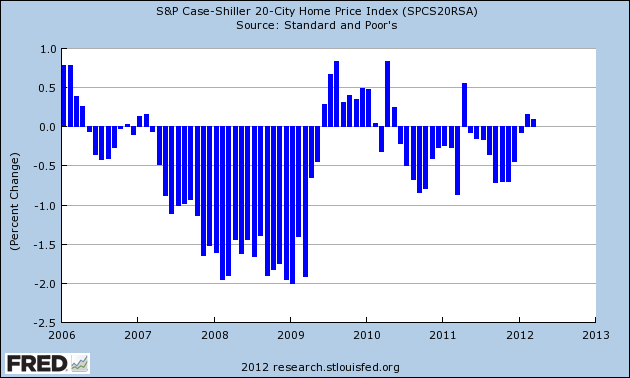
This morning's Case Shiller report of repeat home sales is more evidence that housing prices have already bottomed. Unlike most commentary, which inexplicably focuses on the non-seasonally adjusted index, I focus on the seasonally adjusted data. So long as those adjustments are fair, the month over month seasonally adjusted index is going to show changes in trend well before the year-over-year measures turn.
For April (really an average of February, March, and April), the seasonally adjusted 20 city index rose for the third month in a row. As the below graph shows, outside of the time period when the $8000 housing credit was in effect, this is the first time we have had house price increases for three months in a row since the peak of the market in 2006. (Note: graph does not include this morning's increase):

Beyond the aggregate number, the diffusion of the gains was also impressive. Sixteen of 20 metropolitan areas in the index showed seasonally adjusted month over month gains - meaning the gains were not simply a factor of house prices typically going up in the spring, and were widespread.
On a YoY basis, the index declined only -1.9%.
A year ago, I said that I expected Housing Tracker's index of asking prices to turn positive YoY by early this year. It did, at the end of November of last year. I also said I expected it to lead the Case Shiller index. It did that too. The only caveat I have now, as I had a year ago, is that the turn has been in nominal prices, rather than real, inflation-adjusted prices, which may still be a long way off. At this point the only argument the housing bears have left is waiting for the long-fabled foreclosure tsunami to finally wash ashore.