Monthly data was light this past week. Factory orders for October were down -0.4%. This series has gone flat for the last 3 months. The ISM non-manufacturing index also softened, but remained positive. The University of Michigan's preliminary December consumer confidence report was up more than expected. The expectations index, one of the 10 LEI, was up sharply, having regained over half its loss from July's debt ceiling debacle.
The high frequency weekly indicators are at the point where holiday seasonality strongly affects their week over week performance. YoY comparisons are more important, but whether those comparisons are improving or deteriorating is most important. Most of these indicators again showed strength, with the exception of tax withholding, money supply, and gasoline usage. I again remind new readers that my "Weekly Indicators" column is not designed to be a big picture forecast of the future, but rather by use of high frequency data to capture an up-to-the-minute snapshot of the economy as it is right now.
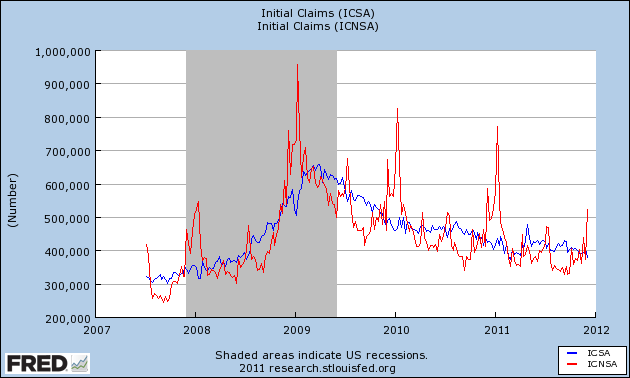
Starting with jobs, the BLS reported that Initial jobless claims declined by 21,000 to 381,000. With the exception of one week last March, this is the lowest initial claims figure in over 3 years. The four week average declined by 2500 to 393,250. This is the first week where year-end seasonality is significant, as shown in this graph:
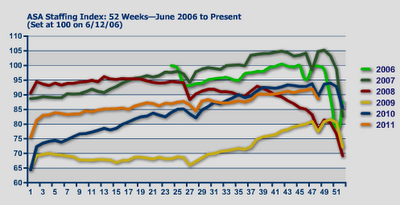
The American Staffing Association Index declined by 3 to 89 last week. This is entirely due to Thanksgiving week seasonality. This series is now just barely below last year's levels, after stagnating earlier this year, as shown in this graph:
Adjusting +1.07% due to the 2011 tax compromise, the Daily Treasury Statement showed that withholding for the first 6 days of December stood at $41.8 B vs. $44.8 B a year ago. For the last 20 reporting days, $136.5 B was collected vs. $134.1 B a year ago, a gain of $2.1 B or +1.8%. I am indebted to Matt Trivisonno of the Daily Jobs Update, who sent me the following graph of the 21-day moving average of withholding tax receipts (red is 2009-10, blue is 2010-11) :
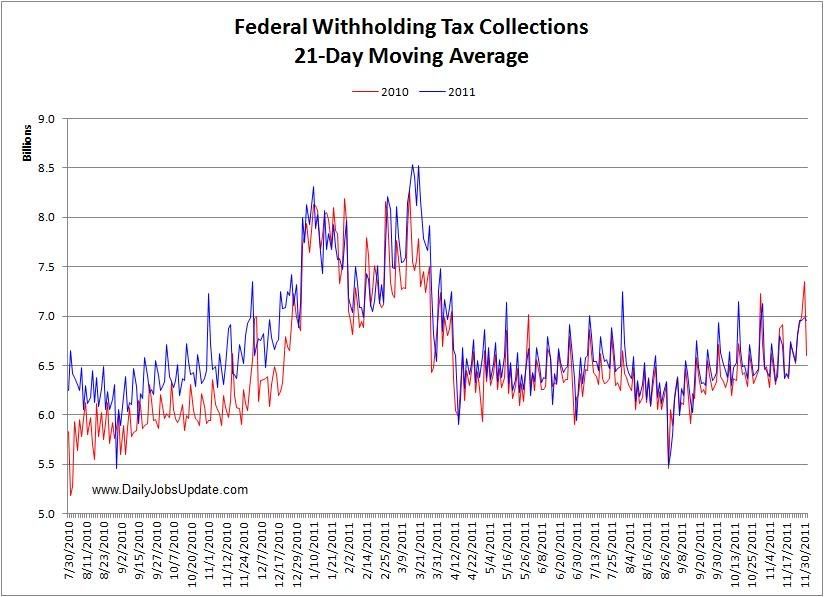
As Matt explains, "It was clearly running ahead last year, and has been neck-and-neck this year, due to the tax cut of course. In September and October, the dips in the 2011 line were consistently above the 2010 line, though you have to squint to see it. Since November, the lines are neck-and-neck again." More graphs and information about withholding tax receipts are available at his site.
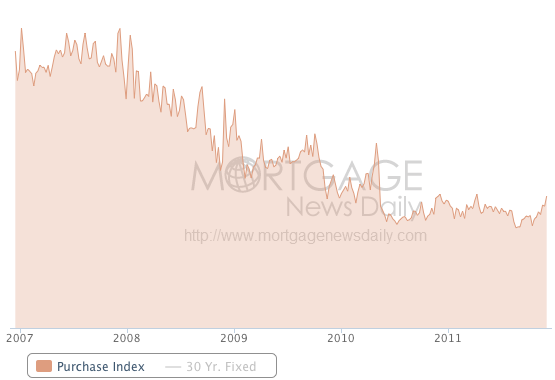
The Mortgage Bankers' Association reported that seasonally adjusted purchase mortgage applications increased 8.3% last week. On a YoY basis, purchase applications were down -0.8%. This primarily reflects a multi-week spike last year vs. flatness this year. The actual reading remains firmly within the range that purchase mortgage applications have been in since May 2010. Refinancing rose +15.3% w/w, exactly reversing its -15.3% decline during the shortened Thanksgiving week. Refinancing continues to be extremely volatile. Purchase mortgage applications have actually been rising for the last 3+ months, as this graph from Mortgage News Daily shows:
For the second week in a row, YoY weekly median asking house prices from 54 metropolitan areas at Housing Tracker were positive, up +0.1% YoY. The areas with YoY% increases in price increased by 1 to 21. Only Chicago continued to have a double-digit YoY% decline.
Retail same store sales were decidedly mixed, as one service reported the lowest YoY gain all year. The ICSC reported that same store sales for the week ending December 3 increased 3.8% YoY, and 2.3% week over week. Shoppertrak, however, reported that YoY sales rose a mere 0.2% YoY and were off a huge -22.5% week over week.
Weekly BAA commercial bond rates increased .17% to 5.18%. Yields on 10 year treasury bonds increased less, up .10% to 2.04%. In the last few weeks, spreads have widened again, representing increasing weakness.
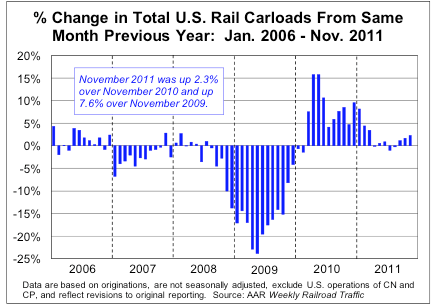
The American Association of Railroads reported that total carloads increased 3.1% YoY, up about 16,700 carloads YoY to 555,400. Intermodal traffic (a proxy for imports and exports) was up 8200 carloads, or 3.5% YoY. The remaining baseline plus cyclical traffic increased 8500 carloads or 2.8% YoY. Total rail traffic has staged an impressive rebound in the last couple of months, as shown in this graph:
Money supply has been flat or down since its Euro crisis induced tsunami of several months ago. M1 increased +0.1% last week, and was unchanged month over month. It is now up 17.9% YoY, so Real M1 remains up 14.3%. This is about 6% under its peak YoY gain several months ago. M2 was unchanged both w/w and month over month. It remains up 9.4% YoY, so Real M2 was up 5.8%. This is also significantly less than its YoY reading at the crest of the tsunami.
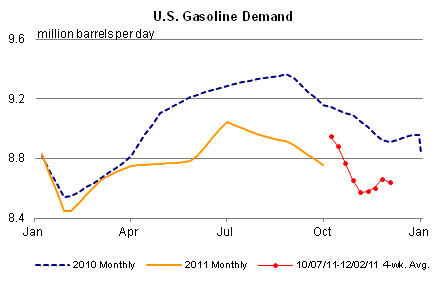
Finally, the Oil choke collar remained in place, as Oil closed at $99.41 a barrel on Friday. This about $4 above the recession-trigger level calculated by analyst Steve Kopits. Gas at the pump, however, decreased $.02 more to $3.29 a gallon. Measured this way, we probably are only about $.05 above the 2008 recession trigger level. Gasoline usage, at 8574 M gallons vs. 9171 M a year ago, was off a whopping -6.5%. The 4 week moving average is off -3.5%. This returns to the pattern of dramatically less usage YoY that started in March and intensified in the last few months, as shown in this graph:
The overall picture continues to be an economy that is expanding again after its summer stall, but the recent stagnation in money supply and $100 Oil are indicative of strong headwinds going forward.
Have a nice weekend.