Oil analyst Steven Kopits, along with Prof. James Hamilton, are the two leading experts on how Oil shocks result in recessions. I have been referring to Mr. Kopits' metric every week in my "Weekly Indicators" summations. Kopits says that every time Oil prices rise to a level of 4% or more of GDP, a recession has followed.
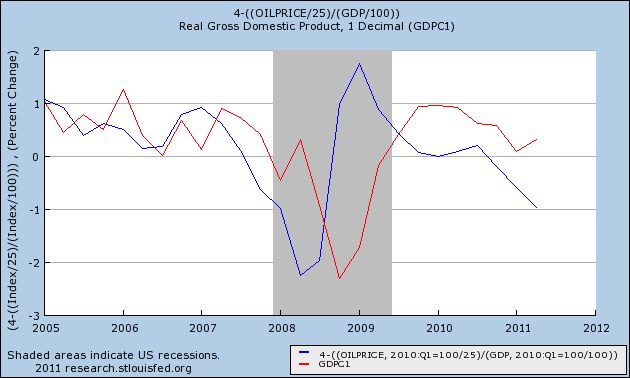
Occasionally even the most popular economic bloggers, including top flight professors, express mystification at why the economy doesn't seem to be able to generate a self-sustaining liftoff. In response thereto, I give you the following graph, in which Oil prices as a percent of GDP are shown in blue (inverted, left scale), and quarterly GDP changes in red (right scale):

A little explanation is in order. The left scale is set to show the divergence in price from Kopits' inflection point of 4% of GDP. Thus the left scale result, n, equals 4 minus Oil price/GDP. If Oil price =5% of GDP, then N = 4-5= -1. Contrarily, if Oil price = 3% of GDP, then N = 4-3 = +1. Also note that since the graph had to be done quarterly, it does not reflect the decline in Oil prices since June 30.
As you can see, since the price of Oil approached the inflection point in 2005, it has predicted GDP changes very well. And it does not bode well for revisions to Q2 2011 GDP or the third quarter either.
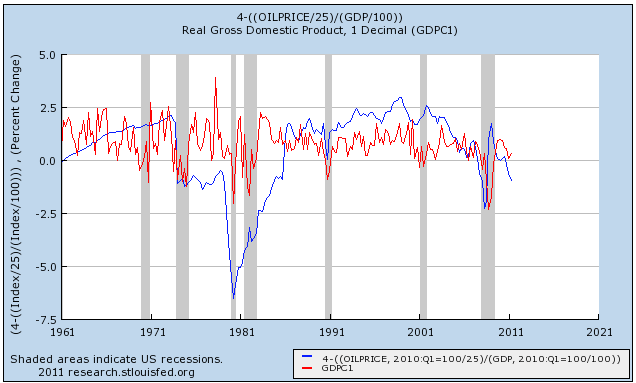
Just to put this in longer perspective for you, here is the a bonus graph - the same relationship expanded to the last 50 years.

The only good thing here is that the public can become habituated to a certain high level of energy prices, and adjust their spending accordingly (this is an insight from Prof. Hamilton). Since we just had $4 gas two years ago, the expected impact on consumer spending isn't as great as if we had never seen this spring's $3.90 gas before.
Overnight Oil went as low as $75.71, which is its lowest price since September 2009, nearly 2 years ago. Proving once again that the remedy for high prices is, high prices (but it's painful).