Two of my favorite topical statistics were released Monday by the Federal Reserve Bank. They are the Household Debt Service Ratio and the Financial Obligations Ratio. Together, these data series show that households continue to trim their debt payments as of the most recent reporting period. Their only failing is that they are released quarterly, and three months after the end of the quarter, so that the data released yesterday covers the period from April to June this year.
Here is how the Federal Reserve defines each statistic, and where they stand as of midyear:
The household debt service ratio (DSR) is an estimate of the ratio of debt payments to disposable personal income. Debt payments consist of the estimated required payments on outstanding mortgage and consumer debt.
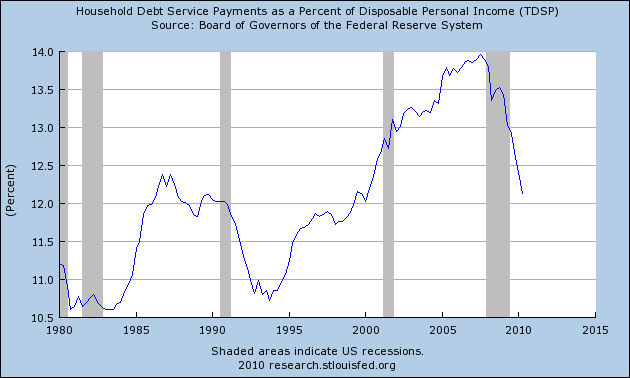
This ratio has been declining by .25% a quarter for over a year, and continued declined again by .28% during the April - June quarter. There is every reason to believe that this ratio now is already about 11.88%.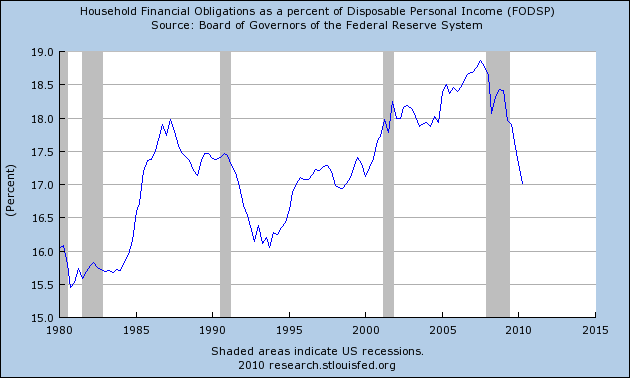
The financial obligations ratio (FOR) adds automobile lease payments, rental payments on tenant-occupied property, homeowners' insurance, and property tax payments to the debt service ratio.

This ratio has been declining by .30% per quarter for over a year, and as of last quarter was 17.02%. There is also every reason to believe that the ratio has declined by about another .30% this quarter to 16.68%, but we won't find that out until the end of the year.
Household debt burdens on average have already declined to the point where they are in less than what they have been in all but about 10 of the last 30 years. At the current rate of decline, household debt burdens will be at an all time low for the series by the end of next year.
This data does not conflict with the recent hubbub in the blogosphere that households have not deleveraged in terms of the total amount of debt owed, as shown in this graph, also from the Federal Reserve, in its most recent flow of funds report:
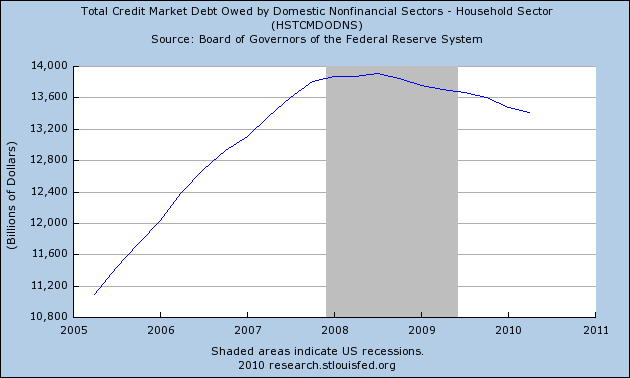
Taken together, what the above three graphs show is that the total amount of outstanding household debt has not declined that much, but the rate of household income devoted to payment of that debt continues to decline.
The reason for this is shown most graphically in the mortgage bankers association's refinance index. Here is where it stood a couple of weeks ago:
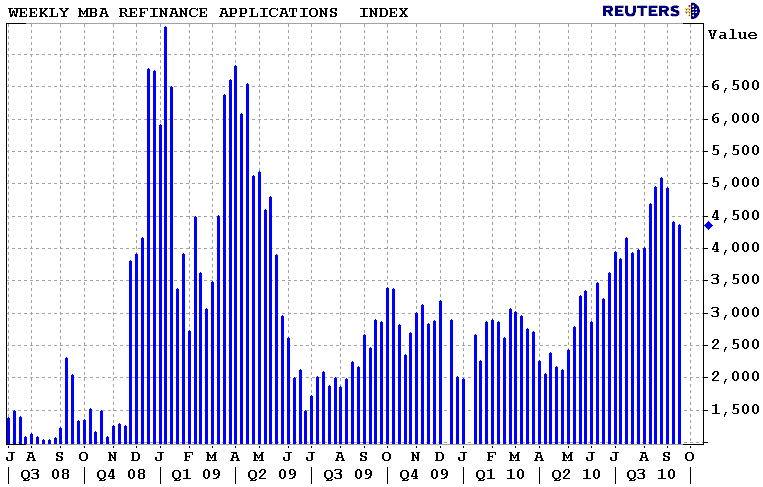
Notice that as mortgage payments approached 4%, a flurry of refinancing occurred both last year and again recently.
In other words, if I refinance a $200,000 mortgage from 6% to 4%, the total amount of my debt hasn't gone down, but the amount I have to pay monthly on that debt has gone down dramatically.
In addition to mortgage refinancing, some deleveraging is being done involuntarily by way of mortgage foreclosures and also by cutbacks in credit card availability.
Also, while the purchases of new cars continue at a 25% reduction from the 16 million annual rate of a few years ago, according to Edmunds.com
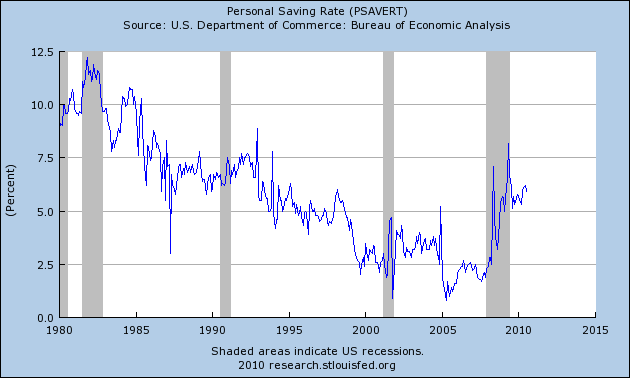
This is of a piece with the increase in the rate of personal savings:
Household debt burdens on average have already declined to the point where they are in less than what they have been in all but about 10 of the last 30 years. At the current rate of decline, household debt burdens will be at an all time low for the series by the end of next year.
This data does not conflict with the recent hubbub in the blogosphere that households have not deleveraged in terms of the total amount of debt owed, as shown in this graph, also from the Federal Reserve, in its most recent flow of funds report:

Taken together, what the above three graphs show is that the total amount of outstanding household debt has not declined that much, but the rate of household income devoted to payment of that debt continues to decline.
The reason for this is shown most graphically in the mortgage bankers association's refinance index. Here is where it stood a couple of weeks ago:

Notice that as mortgage payments approached 4%, a flurry of refinancing occurred both last year and again recently.
In other words, if I refinance a $200,000 mortgage from 6% to 4%, the total amount of my debt hasn't gone down, but the amount I have to pay monthly on that debt has gone down dramatically.
In addition to mortgage refinancing, some deleveraging is being done involuntarily by way of mortgage foreclosures and also by cutbacks in credit card availability.
Also, while the purchases of new cars continue at a 25% reduction from the 16 million annual rate of a few years ago, according to Edmunds.com
said that used car prices nationwide have increased 10 percent from 2009. The report estimated that the average price for a used three-year-old vehicle in July was $19,248, up about $1,800, or 10.3 percent, from July 2009.Contrarily,
as of 2010 the average cost of a new car in the United States is somewhere around $28,400.Thus, as an increasing number of people finance used rather than new cars, or elect to keep driving their car after the time when their car loan is paid off, auto loan debt is declining.
This is of a piece with the increase in the rate of personal savings:

Refinancing and the decline in household debt service obligations show how we have been able to have a modest increase in consumer spending by way of real retail sales and real personal consumption expenditure increases, while still increasing personal savings.