This morning the ISM reported the second part of its data for October. The Non-manufacturing (services) Index came in at 50.6, down from last months's 50.9. The employment part of the Index came in at 41.1, down substantially from September's 44.3. Needless to say, this suggests that layoffs continue apace in the services sector. There was some good news, however, as new orders continued to grow at a faster pace, and vendor deliveries slowed (which is also good news and a leading indicator).
As I reported Monday, the ISM Manufacturing Index came in at a level which has always in the past been consistent with actual job growth. Because in past recessions about 90% of job losses have been in the goods-producing sectors, actual improvement in those sectors was enough to carry the entire economy into job growth.
What has been different in the "Great Recession" is that fully half of all job losses have come in the services sectors. I've posted a chart several times, pointing out that ~3.5 million of the ~7.0 million job losses after August 2008 came from services. Here is that picture graphically:
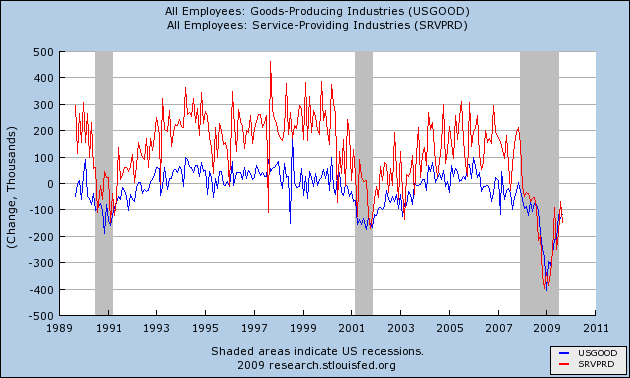
You can see that in the previous mild recessions and "jobless recoveries" of 1991 and 2001, service jobs (red) were relatively unscathed, and recovered first, while goods-producing jobs (blue) felt the brunt of the downturns and recovered last.
Not so this time. Service jobs have felt the full force of this very deep recession, for the full last year. So even if, as I suggested Monday, manufacturing is having a V shaped recovery, that doesn't mean the entire economy is participating. In fact, today's ISM services report virtually guarantees that.
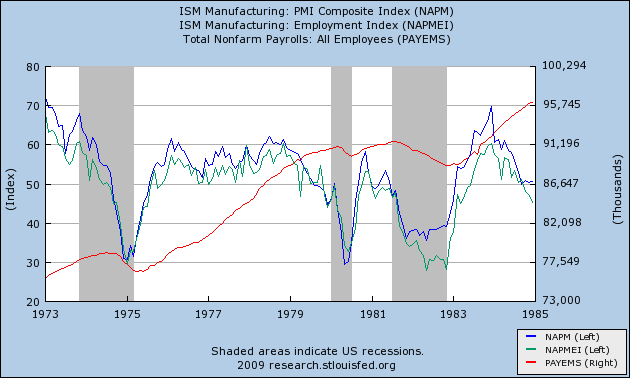
I characterized the ISM manufacturing index report Monday as a "blowout." Here is a graph showing how the overall index (blue) as well as the employment sub-index (light green) in that report stacks up compared with the "jobless recoveries" coming out of the last two recessons, together with jobs (red):
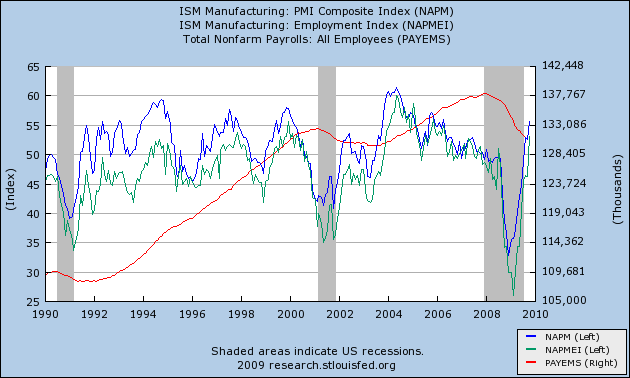
Note that both the blue and light green lines are already at levels they did not reach until well after both the post-1991 and post-2001 recoveries were underway. Specifically, they are already at levels that post-date the times when job losses had stopped, and employment was actually growing.
That brings us back to the ISM services index. Unfortunately, it suffers from the same problem as the "JOLTS" index that some bloggers have been highlighting -- it is only a little over a decade old, and only gives us information about the very shallow 2001 recession.
This graph shows the ISM manufacturing index (as above in blue), together with the ISM services index (in orange) and payrolls (in red):
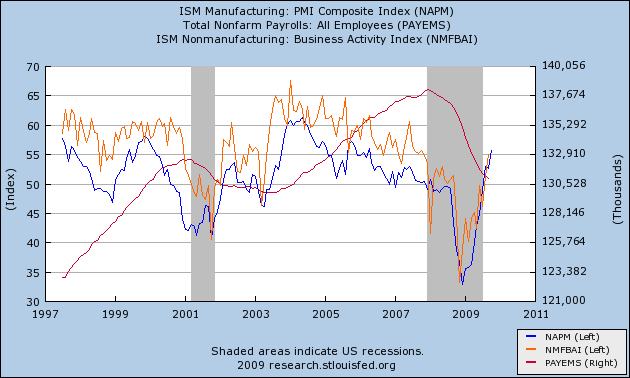
Note that the limited data we have from the last "jobless recovery" indicates that the index had to reach ~60.0 before employment stabilized. The service employment subindex doesn't get graphed by the St. Louis Fed, so I can't show it to you, but I can tell you that it never went below 43.9. Between that reading and 50.0, gains in the sub-index generally coincided with service sector job gains, and declines coincided with job declines.
In this recession, by contrast, the employment sub-index troughed at 31.1 last November, and as of September was still at a reading of 43.4.
I feel much less comfortable making a projection from such limited data, but if we accept it as a best guess, than this morning's report suggests that Friday's October employment/unemployment reports will show little improvement over the last few months'. On the bright side, there may indeed be a "V shaped jobs recovery" in manufacturing, and we may see a positive print for manufacturing jobs. On the negative side, the recovery in the services sector where 85% or more of Americans now work, has at least begun as a "jobless" one.
Why the difference? In manufacturing, quick deep cuts in employment with lean inventories have become the norm. Employers may have cut too deeply and with the snapback in new orders, may need to hire back quickly as well. With services, it's the opposite story. Here's a graph I posted a couple of months ago comparing retail sales with employment:
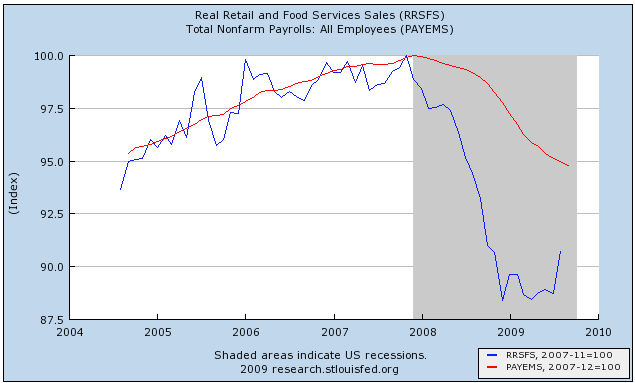
Do retail employers really need 95% of the previous workforce to sell 90% of the previous number of goods? No, and it appears that layoffs will continue in the services sector until those two lines meet, either by sales picking up, employment going down, or a combination of the two.
In that regard, there has been some good news about October retail sales in the last few days. I anticipate discussing that, and updating my "When Will the Economy Add Jobs" series early next week, after this Friday's official jobs data.
----------
P.S. H/t to commenter Brodero who points to an ISM model by Danske Research, whose report on Monday's manufacturing number concludes:
[W]e believe that there is more upside to the ISM index. Our hard-data based inventory demand ratio is to indicating a heavy production back-log in the US economy. This measure of future manufacturing activity is currently sending the most positive signal for the ISM seen in the past 40 years. Furthermore, this is supported by our model, which provides a year-end target for the ISM at 60 and indicates some possibility of even further strength early next year. That said, the recent deterioration in the ISM new orders-inventory ratio suggests that future improvement is likely to happen at a slower rate. In summary, today’s report underpins our forecast for around 4% GDP growth in the current and the coming quarters driven by substantial positive contributions from slower inventory depletion.
Needless to say, an ISM Mfg. number of 60 with +4.0% GDP in the next few quarters is very bullish for job creation.