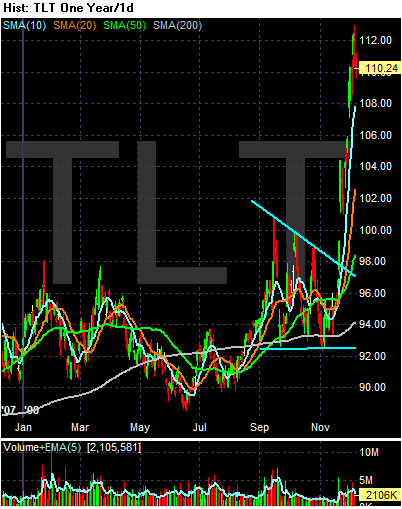
Notice the following on the TLT's
-- Prices consolidated in a triangle pattern from September to mid-November then had a very strong rally
-- The rally from the break-out to the 110 level is a gain of 12.24% -- a pretty impressive monthly gain in the stodgy bond world
-- Prices are above all the SMAs
-- The shorter SMAs are above the longer SMAs
-- All the SMAs are rising
The US 30 year Treasury is currently yielding 3.15%. I have to wonder if that is adequate compensation for a 30 year risk from a 30 loan.

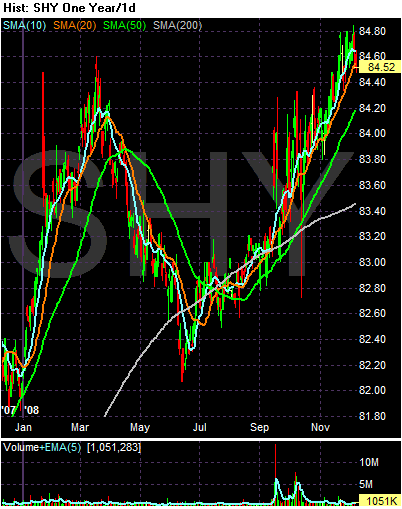
On the SHYs (the short end of the curve) notice the following:
-- Prices started a rally in late June
-- All the SMAs are rising
-- The shorter SMAs are above the longer SMAs
-- Prices are currently right at the 20 day SMA, using it for technical support
-- Also note the SHYs could be forming a long-term double top right now.

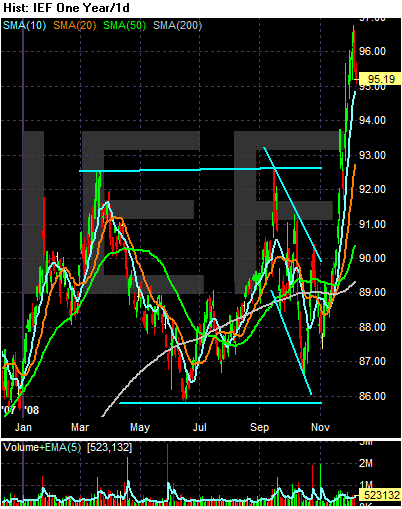
On the year-long IEF chart, notice prices broke out of a year-long consolidation pattern. From low to high the IEF has rallied from 87 to 95 or a gain of about 9%.

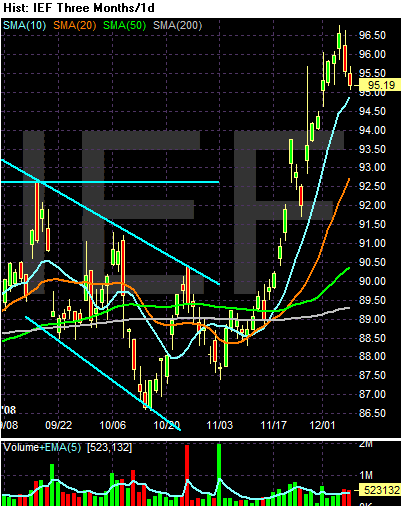
Notice the following on the three month chart:
-- Prices are above all the SMAs
-- The shorter SMAs are above the longer SMAs
-- All the SMAs are moving higer