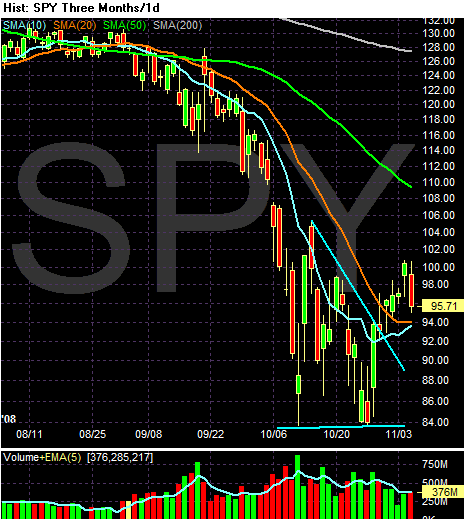
Big sell-off today, but consider the bigger picture.
-- Prices have broken out of the triangle consolidation pattern established in October
-- Prices are still above the 10 and 20 day SMA (meaning the 10 and 20 day SMA are providing technical support for a possible sell-off).
-- The 10 day SMA is about to cross above the 20 day SMA
-- The 20 day SMA is neutral
BUT
-- The 50 and 200 day SMA are both heading lower
-- The shorter SMAs are below the longer SMAs
Bottom line: this chart is sending mixed signals. The short-term trend is bullish but the long term trend is still bearish.