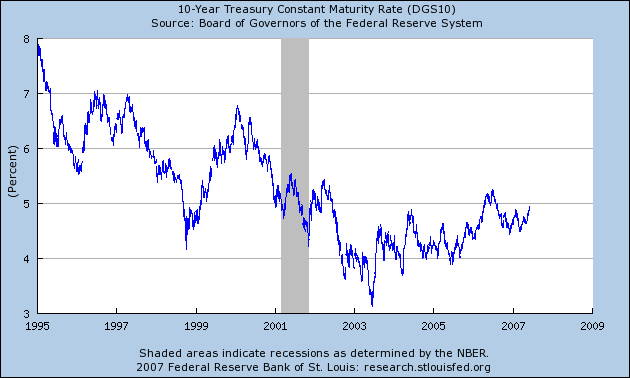
NDD posted a response below that made an good point. Here is a chart of the 10-year constantly maturing treasury from the St. Louis Fed. The chart goes back to 1995. Notice two things.
1.) The trend since 2003 has been up. But
2.) Yields were a lot higher at the end of the 1990s with little impact on overall GDP growth.

