A look at the losers and bigger losers since the stock market began its bumpy ride late last month offers hints about what it will take for the market to rebound in the weeks ahead.
Analysts are keeping an especially close eye on financial stocks, which, beset by woes in the business of selling mortgages to risky subprime borrowers, have been the hardest hit. The sector is something of a bellwether for the market because of its size and because it reflects big-picture economic issues such as inflation.
The financial sector of the Dow Jones Wilshire 5000 index is off 5.5% since the market's one-day plunge on Feb. 27, compared with a 4.4% drop for the whole index. The utilities sector, an investor haven because consumers need to keep the lights on and the water running no matter how shaky the economy, is down just 2.9% in the same period, the second-best performance of the index's 10 sectors.
"Investors have clearly been trying to get more defensive in their portfolios the last few weeks, which is understandable," says strategist Mark Keller of A.G. Edwards & Sons in St. Louis. "They're still in a mode of shedding risk, and things should stay that way awhile longer."
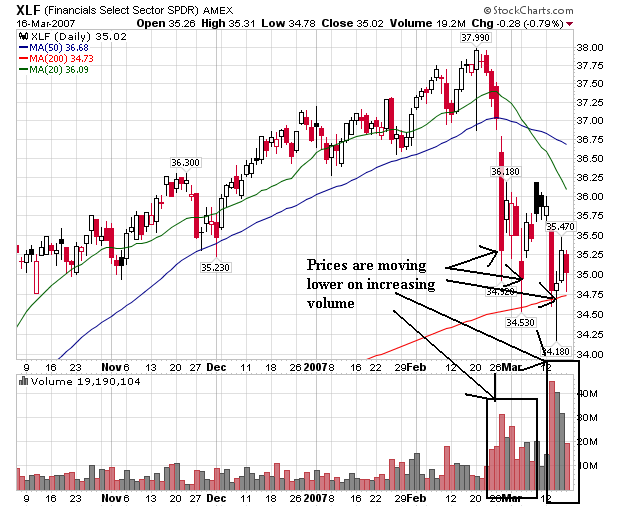
Let's take a look at the longer-term Financial ETF to see what the sector looks like.

This chart says it all. Prices are moving lower on higher volume. That indicates selling momentum is increasing which is a bearish signal.
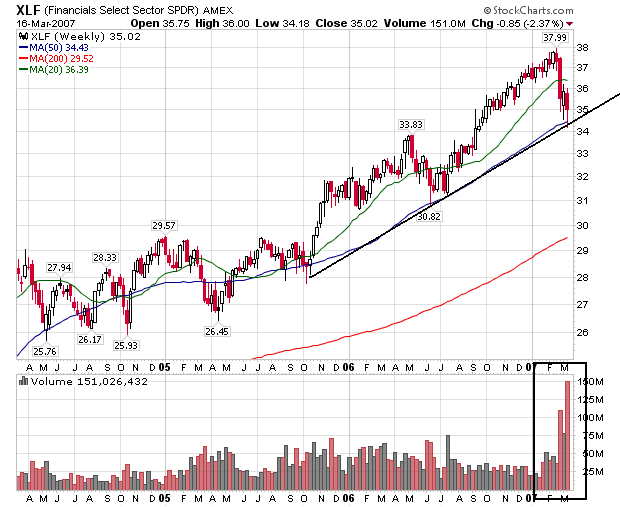
Here's the weekly chart, which shows a few years of price action:

We're still in an uptrend. However, notice the volume spikes over the last three weeks and the downward price movement. If the XLFs move over (roughly) $34.25 on heavy volume, close at that level then stay there for a few days, then the uptrend of the last few years will be broken. That will be a technically important market event and could signal further downward price action for the overall market.