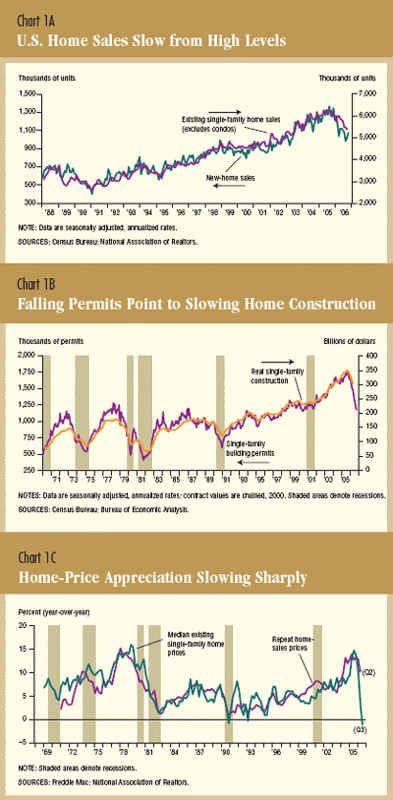
Let's look at it in more detail
1.) New and existing home sales have steadily decreased over the last (roughly) year and a half.
2.) Building permits started to drop at the beginning of 2006 as well.
3.) Year over year home price appreciation has fallen into negative territory.
Here's how the Dallas Fed sums up the graphs:
Today, signs of a housing market slowdown are unmistakable. New and existing home sales have been declining since mid-2005, although they remain high by historical standards (Chart 1A). Building activity has begun to cool a bit, while single-family housing permits have fallen 34 percent from their peak, settling back to pre-2002 levels (Chart 1B). The building permits data suggest further declines in single-family construction are likely, given the usual six to eight months it takes to complete a home.
Housing prices are rising more slowly—perhaps even beginning to decline outright. In the second quarter, the Office of Federal Housing Enterprise Oversight’s measure of home price appreciation registered its biggest year-over-year slowdown since recordkeeping began in 1975. Even so, home-price gains remain solidly positive at 10.1 percent by this measure, which partly controls for changes in home quality by tracking only prices from repeat sales (Chart 1C).
Let's look at two charts from the WSJ courtesy of the Big Picture Blog:
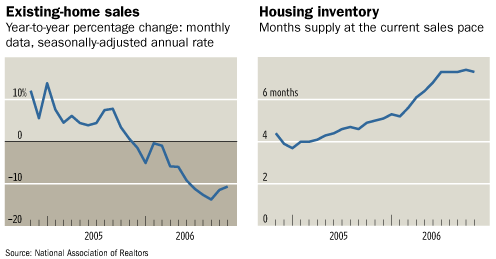
Sales are down and inventory is up. Simple econ 101: increased supply = lower price. Decreased demand = lower price. Put the two together = lower price.
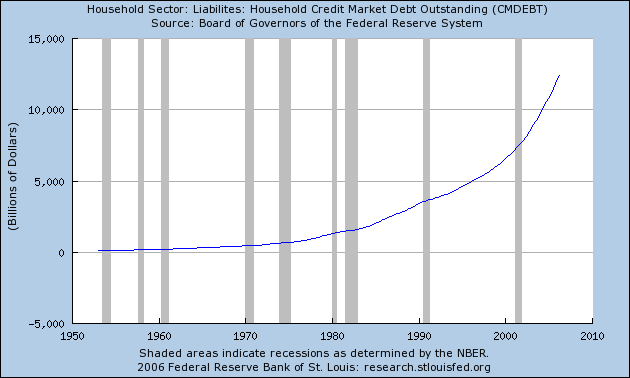
Now -- can people afford any more mortgage debt right now? Probably not. Total household debt is at record levels:
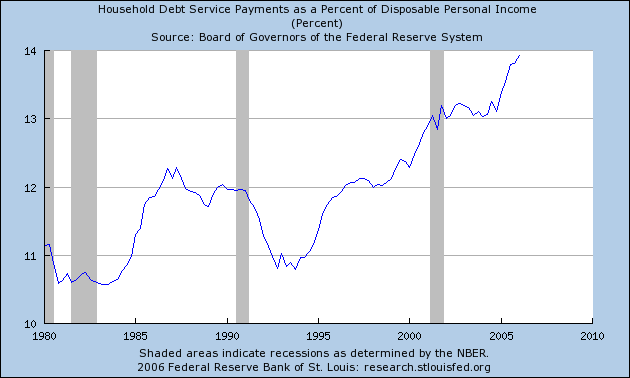
And the financial obligation ratio is also at record levels:
What does this mean for the economy?
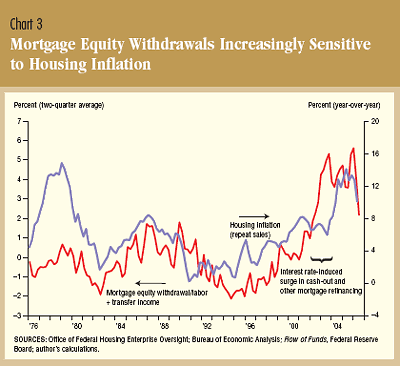
Lower equity withdrawals:
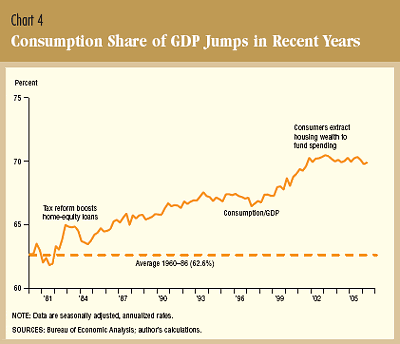
And Lower consumption expenditures:
As the Dallas Fed notes:
The limited U.S. econometric evidence indicates that the strong pace of MEW may have boosted annual consumption growth by 1 to 3 percentage points in the first half of the present decade.[8] This implies that a slowing of home-price appreciation into the low single digits might shave 1 to 2 percentage points off consumption growth and 0.75 to 1.5 percentage points from GDP growth for a few years.
While these estimates provide an idea of housing’s potential economic impact, considerable uncertainty exists about how much a slowdown in MEW might restrain consumption growth. Key issues include how much home-price appreciation might slow, how much the deceleration would affect MEW and how much a slowdown in MEW would restrain consumer spending.