Copper prices in New York fell for the third session in a row on speculation demand will lag behind supplies with global inventories of the metal close to the highest since July 2004.
Stockpiles monitored by exchanges in London, Shanghai and New York have jumped 52 percent in the past three months, data compiled by Bloomberg show. Copper prices have dropped 36 percent from a record $4.04 a pound on May 11.
``The inventories are rising, and the price is falling,'' said John Gross, director of metals management at Scott Brass Inc. in Cranston, Rhode Island. ``The sentiment has changed. The market has been in a downtrend after copper broke the psychologically important $3 a pound level'' last month, he said.
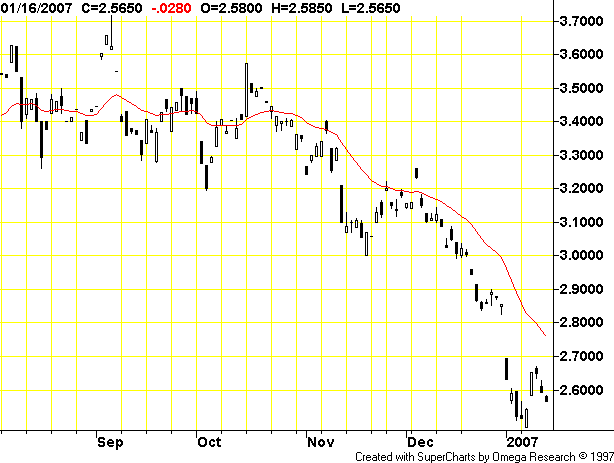
Here' the daily copper chart:

We have a clear downtrend that started in mid-October. We also have a big gap-down in late December/early January. Downward gaps are very bearish chart signs; they signal a lot of downward price pressure.
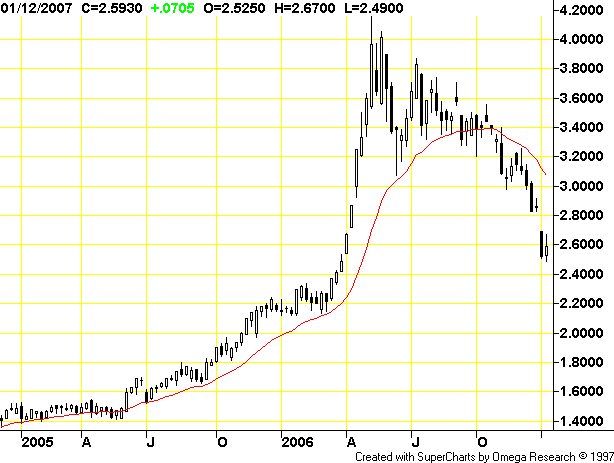
Here's the monthly chart:

Prices really peaked back in late April/early May and have been in a downtrend since. We see the downtrend accelerate at the end of last year.
The Bloomberg article is pretty clear -- inventories have increase in 50% in three months. That indicates there there is a either a big drop in demand or middle men have greatly overestimated copper demand. Either way, excess supply = lower price.