Saturday, November 13, 2021

Weekly Indicators for November 8 - 12 at Seeking Alpha


 - by New Deal democrat

My Weekly Indicators post is up at Seeking Alpha.

Surprisingly, given the big increase in the CPI (that is likely to continue via “owner’s equivalent rent”), almost all the indicators across all timeframes remain positive.

As usual, clicking over and reading will bring you up to the virtual moment, and bring me a little bit of renumeration for my efforts. 

Friday, November 12, 2021

September JOLTS report: slow progress towards a new equilibrium


 - by New Deal democrat

This morning’s JOLTS report covers September, at the beginning of which the Delta wave peaked and then gradually receded for the remainder of the month. It is also the month that the last of pandemic emergency benefits ended. 

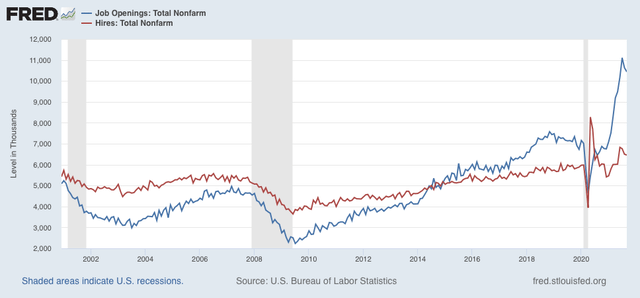
We did see the second consecutive decline in job openings, as they decreased 191,000 to 10.438 million (blue in the graph below), while actual hiring  (red) also decreased 38,000 to 6.459 million:

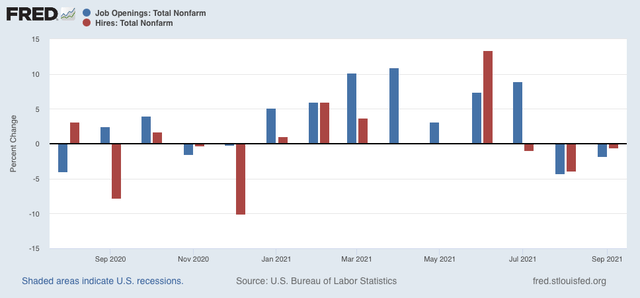
Here are the month over month percentage changes for each of those metrics since May of last year:


Since May, openings have increased a net of 955,000, while actual hires have increased 437,000.

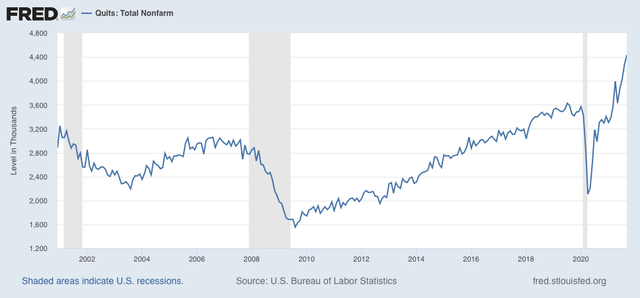
Of a piece with the above, voluntary quits rose to yet another new record of 4.434 million:


The record number of people voluntarily quitting their jobs (meaning they are not eligible for unemployment benefits) is testimony to the record robustness of the jobs market despite the ending of emergency pandemic benefits.

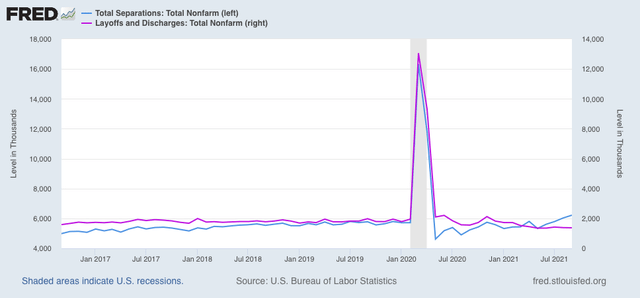
Layoffs and discharges (violet, right scale) declined by 48,000 to 1.375 million which, after revisions to previous months’ data, is slightly above May’s record low of 1.353 million, while total separations (light blue, left scale) rose by 186,000 to 6.218 million, the highest since April of 2020, and higher than at any point during the last two expansions:


Two months ago I wrote that “this is a market that continues to be out of equilibrium and is searching for a new one.” We continue to make slow progress towards that equilibrium as openings slowly decline. The record number of quits and the continued near record low in layoffs and discharges nevertheless indicates that the market remains very tight and tilted in favor of labor over management (for the first time in over 20 years).

While the extra ‘cushion’ of saved emergency benefits appears to have been exhausted, the inability to find child care, or concerns about the safety of jobs on offer, remain likely factors as to why there are not more people actually seeking jobs.

As previously indicated, I do not believe that a new equilibrium in the jobs market will be reached until the COVID pandemic recedes at least into a tolerable background status. Based on the slow pace of the decline in jobs openings, it looks like that will take at least another year.

Coronavirus dashboard for November 12: regional variations and the winter wave


 - by New Deal democrat

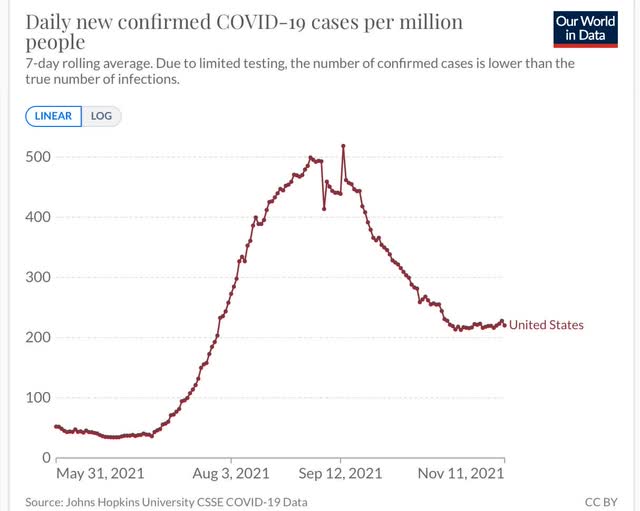
There’s a glitch in 91-Divoc collecting Johns Hopkins data, so the State by State totals have not been updated for several days, but here is Our World in Data’s update for the US as a whole:


As of yesterday, cases are up only 3.5% from their recent low 2 weeks ago.

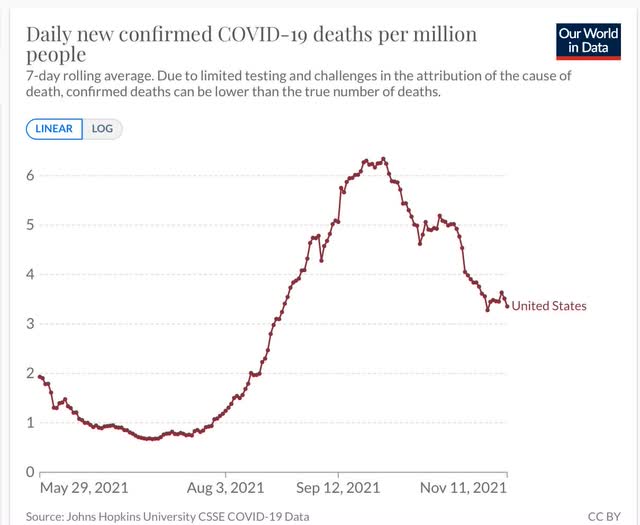
Meanwhile, deaths have also stopped declining, but have not increased from their low of just over 1100/day last week:


The big question for the immediate future is what kind of winter wave will there be in the US? Dr. Eric Topol, looking at the bad outbreak in Europe, which by and large has higher vaccination rates than the US, yesterday forecast that it would be another awful wave like the Delta wave this summer. I’m not so sure.

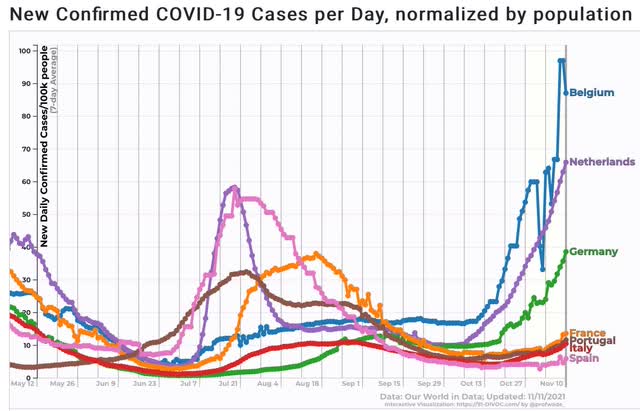
Here are the daily case averages from Western Europe:


With the exception of Belgium, there is a distinct correlation between how low (high) the summer Delta wave was, and how high (low) the current incipient winter wave is. In other words, it still looks like waves of infection confer a level of resistance to re-infection for at least some limited period.

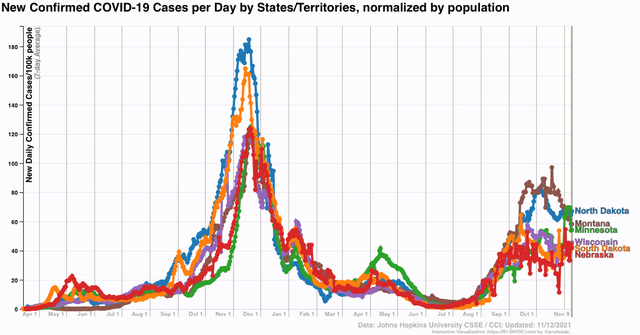
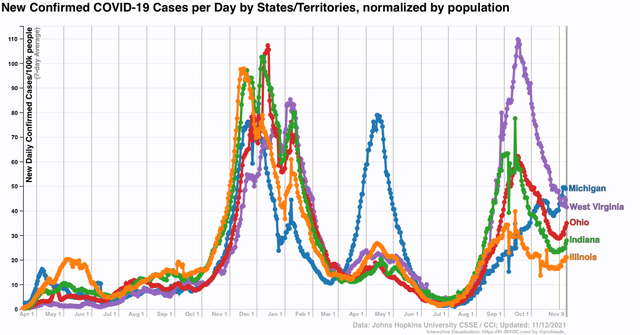
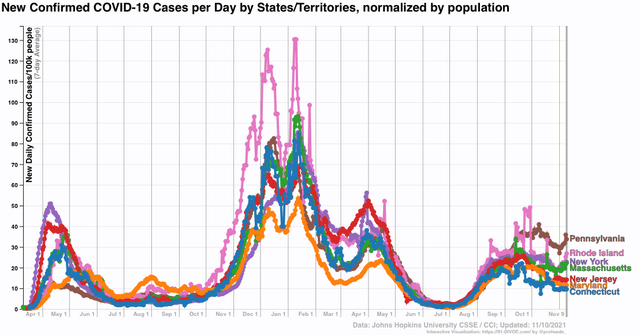
That same pattern has been the case in the past 18 months in various regions of the US. Here are breakdowns for 4 different regions: western Midwest and northern Mountains, eastern Midwest, Deep South, and Northeast corridor:


It is noteworthy how cases rise and fall mainly in sync in all four regions, but out of sync with one another, and despite the fact that three of the regions have similar climates.

In the area centered on the Dakotas, cases peaked in November 2020 and declined throughout the winter, despite virtually no vaccination. They also did not suffer much during the summer Delta wave, but have seen an increase now.

In the eastern Midwest, by contrast, there was a severe winter wave that typically peaked in December or January, and a much bigger impact from the Delta wave. Note also the experience of Michigan which suffered an anomolous huge outbreak in the spring, avoided Delta all summer, and now is seeing rising cases.

In the Deep South, there were outbreaks during both summers, with the Delta outbreak being by far the worst. Also, there was no outbreak until late last winter.

Finally, in the Northeast, there was the bad initial outbreak in spring 2020, virtually no increase during the summer, and then a huge winter wave last year with a small echo in the spring. Delta’s impact was marginal, as is the current increase in cases.

Certainly the excellent vaccination rates in the Northeast vs. poor vaccination rates in the Deep South and Plains and Mountain States have played a role. But it also appears that infections roll in and out in waves, and that having recently experienced a wave confers some resistance to re-infection in the States most affected.

This suggests to me that Topol’s conclusion is too pessimistic. I suspect the regions most badly affected by Delta this summer will not see big winter waves for another few months, while those areas that (relatively) escaped Delta have probably already begun increases towards (relatively) bad winter experiences. But these are still going to be mainly confined to the unvaccinated, the pool of which is shrinking by the day, particularly with vaccine approvals for younger children.

Thursday, November 11, 2021

Why Yesterday’s CPI report was so important


 - by New Deal democrat

As promised, here is a link to my article, Why Yesterday’s CPI Report was such a Big Deal, over at Seeking Alpha.

I go into a great deal of detail parsing the report, particularly with regard to how the huge increase in house prices as has been recorded by both the Case Shiller and FHFA house price indexes, is now bleeding over into “owner’s equivalent rent,” the CPI’s official measure of housing inflation, and which is over 1/3 of the entire consumer inflation measure.

This in turn has implications for “real” wages and for “real” consumer spending, which in turn have big implications for the economy as a whole, 2/3’s of which is precisely that consumer spending.

I explain why this means that the consumer picture has darkened, and what I will be watching for to see if it spreads to the producer or financial sectors.

As usual, clicking over and reading should be helpful to you in understanding the current economy, and pay my lunch bill.

Programming note on yesterday’s inflation report


 - by New Deal democrat

As noted yesterday, I wrote an extensive post on why the consumer inflation report was such a Big Deal for the economy.

Because it wound up going into much more detail about the economic forecast, I submitted it to Seeking Alpha (why not earn some lunch money for my efforts?). When they post it over there, I’ll post a link here.

Wednesday, November 10, 2021

Nobody is (still) getting laid off


 - by New Deal democrat

[Note: This morning’s consumer inflation report was very important, and not in a good way. So I plan on doing a more extensive post on it tomorrow, and I’ll probably put off the next “Coronavirus Dashboard” till Friday.]

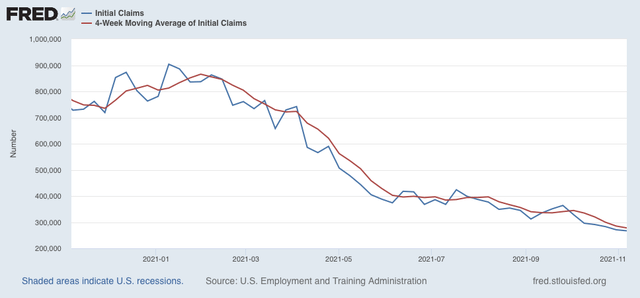
Initial claims declined another 4,000 this week to 267,000, and the 4 week average declined 7,250 to 278,000, both new pandemic lows:


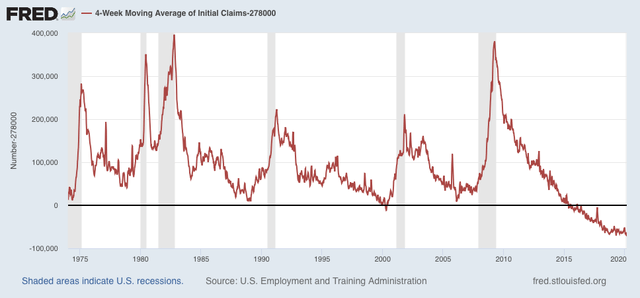
For the past 50 years, initial claims have only been at these levels for 2 months at the peak of the late 1990’s tech boom, and from late 2015 to just before the pandemic in 2020.


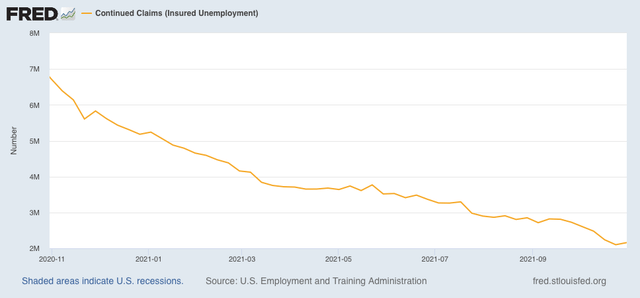
Continuing claims, on the other hand, rose 59,000 from last week’s pandemic low to 2,160,000:


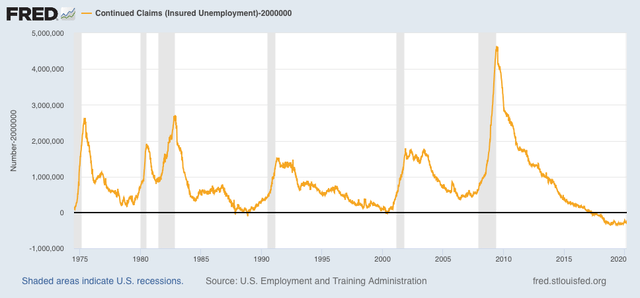
Similarly, only a few weeks in the late 1980s, plus 2 months in 1999, plus the last 4 years of the last expansion were below this number:

The labor market remains extremely tight. For all intents and purposes, nobody is getting laid off. 

Tuesday, November 9, 2021

Producer price inflation: it’s a gas!


 - by New Deal democrat

I normally do not pay much attention to producer prices, but with the huge increase in spending earlier this year and the ensuing supply bottlenecks taking center stage, the course of inflation has emerged as the most pressing economic issue.

To recap briefly, with the second round of pandemic stimulus checks early this year, retail spending increased over 10% between last October and this past March; and has only backed off by about 1/4 of that gain since. This has stretched supply lines to the breaking point. Increased demand + constrained supply —> an inflationary surge.

To cut to the chase, as has often been the case since I started highlighting them, weekly high frequency indicators give us the best notice of incipient turning points - and are doing so currently with inflation.

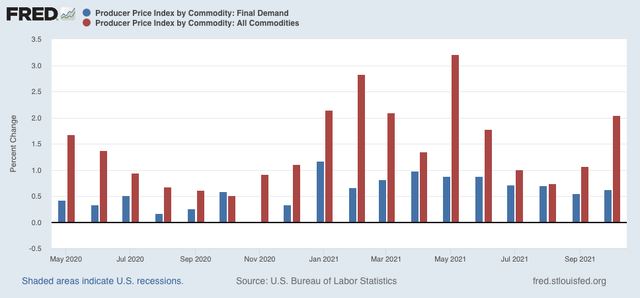
This morning’s producer price index showed a monthly increase for October of 0.6% (blue in the graph below), while raw commodity prices increased 2.0% (red):


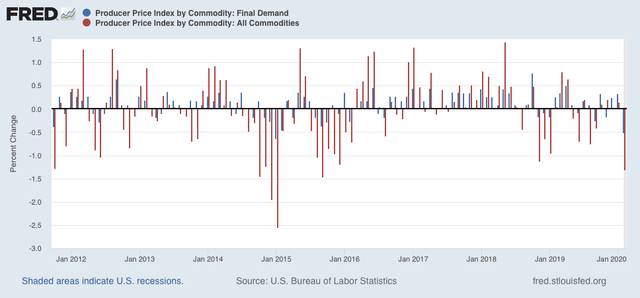
This contrasts with average producer price increases of less than 0.4% in the 10 years prior to the pandemic, with typical raw commodity price changes of between -0.2% and +0.5%:


Perhaps most worrisome is (or would be) the renewed spike in commodity prices of +2.0% (red) in October, the highest since May.

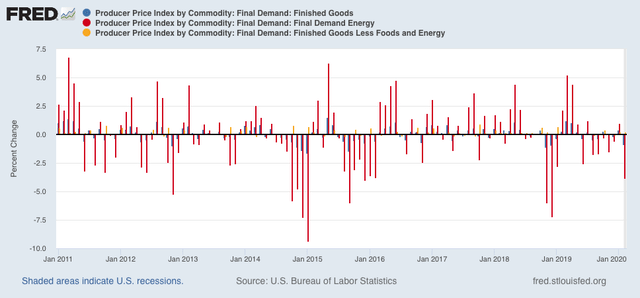
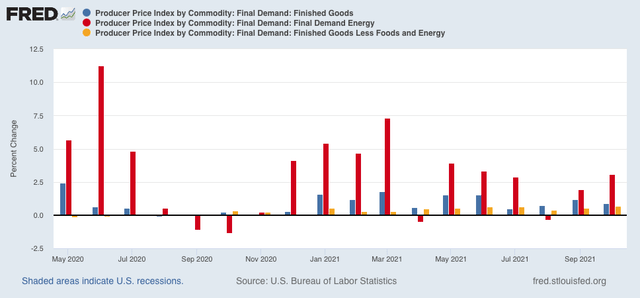
So, where is this renewed commodity price push coming from? In the below three graphs, I’ve broken them down between finished goods (blue), energy (red), and all commodities ex-food and energy (gold).

Here is the 10 year period before the pandemic:


Energy costs rarely rose more than 2.5% in any given month, and finished goods and prices ex-food and energy rarely rose more than 0.5%.

Now here is the post-pandemic recession data:


Monthly price increases ex-food and energy have been running at 0.5%-0.6% monthly, and finished goods at 0.5%-1.5%. But energy costs have increased between 2.5%-5.0% in most months.

In other words, the biggest culprit in producer price inflation in the past 16 months has been energy costs.

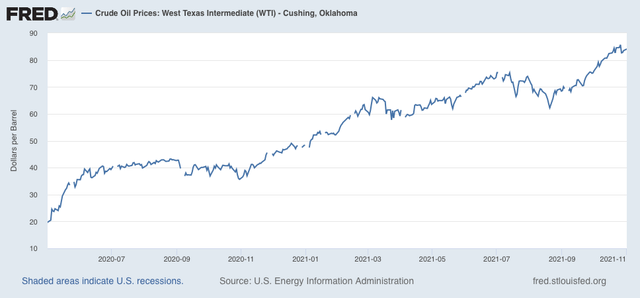
Indeed, oil prices have doubled in the past year, and increased 20% in September and October alone:


But the above shows a peak on October 26, which remains the recent high as of today.

In other words, the big commodity price increase in October is all about the price of oil. But prices have backed off slightly in the past 2 weeks, which as readers of my “Weekly Indicators” columns know, is of a piece with recent declines in the prices of shipping transport and industrial metals. If these are indeed the peak prices from the supply bottleneck, than producer prices should ease from here.

Sunday, November 7, 2021

‘Brutus,’ the anti-federalist who presciently foresaw the Imperial Supreme Court


 - by New Deal democrat

As you may recall, for the past several years I have done a great deal of historical reading about Republics; how they were structured, what were their strengths and weaknesses, whether they were able to last a long time, and whether they were consistent with “empire”-sized dominions.


One of the revelations of that excursion was realizing that the US Constitution was hardly novel in its design of the Legislative and Executive bodies. The House of Representatives reflected the historical “assembly of the people” in both Ancient Rome and most medieval city-state republics, as well as the House of Commons in the UK. The Senate explicitly called back to the Senate of Rome as well as the House of Lords in the UK. The real radical departure in the US Constitution was the complete separation of the Judicial Branch from both the Executive and Legislative Branches.

In all ancient and midieval republics, the judiciary was an arm of the Executive. It  enforced the law in individual cases, and judges served at the pleasure of the Executive, or else changed with each new Executive Administration.

The first revolution in the Judiciary followed the UK’s “Glorious Revolution.” No longer did judges in the UK serve at the monarch’s pleasure; rather, they held office for “good behavior,” a term that was explicitly carried over into the US Constitution.

As we know, Article III of the US Constitution enshrines this same principle, a de facto lifetime appointment. Once a Supreme Court Justice is appointed, the only limit on their power is their own self-restraint in interpreting the applicability of the Constitution to any issue. As we are currently observing with the majority radical reactionary wing of the Supreme Court, there appears to be little such self-restraint in evidence. And the Justices were deliberately selected for their relative youth, so that their appointments would last decades into the future.

This fundamental issue with the US Supreme Court was throughly understood and argued in 1789 by the anti-Federalist Brutus, whose views on the Judiciary likely prompted Hamilton’s famous Federalist #78, which claimed that the judiciary would be “the least dangerous branch.”  I discussed that Federalist at length previously, concluding that Hamilton’s argument was:

In summary, lawyers selected for their lifetime of skill and acumen in understanding past precedents would essentially engage in statutory interpretation according to the long-established rules for such interpretation. Any errors they made would be no more than an “inconvenience” that would never “affect the order of the political system.” In any event, they would be powerless to enforce their decisions, and would have to rely on the Executive. Further, their errors they made could be remedied by Constitutional Amendments. Finally, if they did attempt to act like superlegislators, they would suffer impeachment and removal from office.

Brutus opposed the Constitution that was proposed in Philadelphia on a number of grounds that would be familiar to modern critics - that the “necessary and proper” clause regarding Congressional power would increasingly encroach on State’s rights, to the point of making State power vestigial compared with overweening federal power; that there were not nearly enough representatives for any given population, which would lead to wealthy plutocrats’ control of those bodies; that the sheer empire-size of the US as a whole militated against the ability to maintain it as a government of limited powers; that the ability to have a standing army would create a separate military interest group that would be difficult for civilian government to contain; and that there were no safeguards for federal criminal defendants, the specific criticisms of which were addressed in the 5th and 6th Amendments in the Bill of Rights.

But Brutus also spotted critical and radical differences between the proposed US Supreme Court and the semi-independent judiciary in the UK.

To begin with, the Judiciary in the U.K. solely had the power to interpret Acts of Parliament. They were without power to declare them null and void as against some higher standard. In letter XV, Brutus says:*
The judges in England, it is true, hold their offices during their good behavior, but then their determinations are subject to correction by the house of lords; and their power is by no means so extensive as that of the proposed supreme court of the union. — I believe they in no instance assume the authority to set aside an act of parliament under the idea that it is inconsistent with their constitution. They consider themselves bound to decide according to the existing laws of the land, and never undertake to control them by adjudging that they are inconsistent with the constitution — much less are they vested with the power of giving an equitable construction to the constitution.... and ...
The judges in England are under the control of the legislature, for they are bound to determine according to the laws passed by them. But the judges under this constitution will control the legislature, for the supreme court are authorized in the last resort, to determine what is the extent of the powers of the Congress....

Further,
In England the judges are not only subject to have their decisions set aside by the House of Lords, for error, but in cases where they give an explanation to the laws or constitution of the country, contrary to the sense of the parliament, though the parliament will not set aside the judgment of the court, yet, they have authority, by a new law, to explain a former one, and by this means to prevent a reception of such decisions.

Indeed, in Letter XVI, Brutus sets forth a very convention scholarly view of the structure of republican governments:

When great and extraordinary powers are vested in any man, or body of men, which in their exercise, may operate to the oppression of the people, it is of high importance that powerful checks should be formed to prevent the abuse of it.

Perhaps no restraints are more forcible, than such as arise from responsibility to some superior power. ... The legislative power should be in one body, the executive in another, and the judicial in one different from either. But still each of these bodies should be accountable for their conduct.

...the supreme judicial ought to be liable to be called to account, for any misconduct, by some body of men, who depend upon the people for their places ....

Turning to the proposed US Constitution, Brutus says in Letter XI:

It is ... of great importance, to examine with care the nature and extent of the judicial power, because those who are to be vested with it, are to be placed in a situation altogether unprecedented in a free country. They are to be rendered totally independent, both of the people and the legislature, both with respect to their offices and salaries. No errors they may commit can be corrected by any power above them, if any such power there be, nor can they be removed from office for making ever so many erroneous adjudications....The only causes for which they can be displaced, is, conviction of treason, bribery, and high crimes and misdemeanors.

In that same letter, Brutus sees that the Justices of the Supreme Court will be able to read their own preferences into ambiguities found in the Constitution:

This part of the plan is ... to authorise the courts, not only to carry into execution the powers expressly given, but where these are wanting or ambiguously expressed, to supply what is wanting by their own decisions....

They will give the sense of every article of the constitution, that may from time to time come before them. And in their decisions they will not confine themselves to any fixed or established rules, but will determine, according to what appears to them, the reason and spirit of the constitution. The opinions of the supreme court, whatever they may be, will have the force of law; because there is no power provided in the constitution, that can correct their errors, or control their adjudications. From this court there is no appeal.

Brutus went into further detail in the vastness of the power being given to the Supreme Court in Letter XV:

I said in my last number, that the supreme court under this constitution would be exalted above all other power in the government, and subject to no control. .... I question whether the world ever saw, in any period of it, a court of justice invested with such immense powers, and yet placed in a situation so little responsible.

they [the Justices] are to give the constitution an explanation, and there is no power above them to set aside their judgment. The framers of this constitution appear to have followed that of the British, in rendering the judges independent, by granting them their offices during good behavior, without following the constitution of England, in instituting a tribunal in which their errors may be corrected; and without adverting to this, that the judicial under this system have a power which is above the legislative, and which indeed transcends any power before given to a judicial by any free government under heaven.

“they have made the judges independent, in the fullest sense of the word. There is no power above them, to control any of their decisions. There is no authority that can remove them, and they cannot be controlled by the laws of the legislature. In short, they are independent of the people, of the legislature, and of every power under heaven. ...

... there is no power above them that can controul their decisions, or correct their errors. There is no authority that can remove them from office for any errors or want of capacity, ... and in many cases their power is superior to that of the legislature.

The adjudications of this court are final and irreversible, for there is no court above them to which appeals can lie, either in error or on the merits.

....

this court will be authorised to decide upon the meaning of the constitution, and that, not only according to the natural and ob[vious] meaning of the words, but also according to the spirit and intention of it. In the exercise of this power they will not be subordinate to, but above the legislature. .... The supreme court then have a right, independent of the legislature, to give a construction to the constitution and every part of it, and there is no power provided in this system to correct their construction or do it away. If, therefore, the legislature pass any laws, inconsistent with the sense the judges put upon the constitution, they will declare it void; and therefore in this respect their power is superior to that of the legislature.  But no such power is in the legislature. The judges are supreme — and no law, explanatory of the constitution, will be binding on them....

.... If the states remonstrated, the constitutional mode of deciding upon the validity of the law, is with the Supreme Court, and neither people, nor state legislatures, nor the general legislature can remove them or reverse their decrees.”

In Letter XI, Brutus forecast the likely result:

[T]hey will be interested in using this latitude of interpretation. Every body of men invested with office are tenacious of power; ... this of itself will operate strongly upon the courts to give such a meaning to the constitution in all cases where it can possibly be done, as will enlarge the sphere of their own authority. ....

This power in the judicial, will enable them to mould the government, into almost any shape they please. ... Men placed in this situation will generally soon feel themselves independent of heaven itself.”

In summation, Brutus argued that the US Constitution did not in fact lay out three equal branches of government, but rather a system of “Judicial Supremacy.” Indeed most contemporary legal scholars accept that this is exactly what the outcome has been.**


To the charges of Brutus, Hamilton’s response in Federalist Nos. 78 and 81 was, first, that there was nothing in the US Constitution 

which DIRECTLY empowers the national courts to construe the laws according to the spirit of the Constitution.

Further, 

No legislative act ... contrary to the Constitution, can be valid. .... A constitution is, in fact, and must be regarded by the judges, as a fundamental law. It therefore belongs to them to ascertain its meaning, as well as the meaning of any particular act proceeding from the legislative body. If there should happen to be an irreconcilable variance between the two, that which has the superior obligation and validity ought, of course, to be preferred.”

As to Brutus’s most weighty charge, that the Court would become dictatorial in enacting their own pleasures and prejudices as the supreme law of the land, Hamilton wrote:

It can be of no weight to say that the courts, on the pretense of a repugnancy, may substitute their own pleasure to the constitutional intentions of the legislature

because poor Supreme Court decisions can be remedied by Constitutional Amendment:

A legislature, without exceeding its province, cannot reverse a determination once made in a particular case; though it may prescribe a new rule for future cases. This is the principle, and it applies in all its consequences, exactly in the same manner and extent, to the State governments, as to the national government now under consideration. Not the least difference can be pointed out in any view of the subject. 

Hamilton several times cites the structure of the State government of New York. Thus it is instructive to review New York’s amendment process, which is similar to that of many States.  So, here is the process in New York for amending that State’s Constitution:

In New York, the amendment must be introduced by sponsors in both the New York State Senate and Assembly. Identical versions of the amendment must be passed in each house. If that occurs, it is referred to the next regular two-year legislative session which follows each of the general election of the members of the Legislature. Following second passage of the amendment by the newly elected Legislature, it is placed on the ballot for a statewide voter referendum. Once the amendment is approved by the majority of voters in the state, it is incorporated into the NYS Constitution. No supermajority is required.

By contrast, the US Amendment process is much more difficult. The identical language must be agreed to by 2/3’s of both the House and Senate, and then by 3/4’s of all State legislatures.

As the present reactionary Supreme Court majority, installed as younger men and women to assure decades’-long tenures, embarks upon a poorly hidden mission to overturn over a century of established civil rights and economic Court precedents, Brutus’s arguments ring particularly true.

One final note: although Brutus lost his contemporary argument with Hamilton, no less an authority than James Madison, often considered the intellectual architect of the US Constitution, came to agree with him, advocating for a Legislative “Council of Revision,” writing:

In the State Constitutions & indeed in the Federal one also, no provision is made for the case of a disagreement in expounding them; and as the Courts are generally the last in making their decision, it results to them, by refusing or not refusing to execute a law, to stamp it with its final character. This makes the Judiciary Dept paramount in fact to the Legislature, which was never intended, and can never be proper. 

Madison proposed that, following an intervening election, the Congress could override an adverse Supreme Court decision by a supermajority vote of 2/3’s or 3/4’s of both Houses, saying

It should not be allowed the Judges or the Executive to pronounce a law thus enacted Unconstitutional and invalid.***

*The collected Letters of Brutus can be found at the Teaching American History website. 

** I am indebted to the essay Federalist #78 and Brutus’ Neglected Thesis on Judicial Supremeamcy, by Solomon Slonim

*** James Madison, Observations on the “Draught of a Constitution for Virginia,” Madison: Writings, 417.

Saturday, November 6, 2021

Weekly Indicators for October 1 - 5 at Seeking Alpha


 - by New Deal democrat

My Weekly Indicators post is up at Seeking Alpha.

As I point out from time to time, one of the biggest values in tracking data that is reported with high frequency, i.e., weekly as opposed to monthly or quarterly, is that you are able to spot changes in trends much more quickly.

Apropos of which, the surge in consumer spending + shipping bottlenecks had caused shipping and commodity prices to spike. In the past few weeks, the theme of these “Weekly Indicator” pieces has been evidence that the spike may be peaking. This week’s column continues that theme with more evidence.

As usual, clicking over and reading will bring you up to the virtual moment, and rewards me a little bit for my efforts.

Friday, November 5, 2021

October jobs report: a very strong report putting to rest questions about the strength of the expansion


 - by New Deal democrat

In the light of the last two month’s relatively “poor” jobs readings, an important question was what was going to happen with revisions. As we will see below, they really delivered! - big positive revisions to both of the last two months’ numbers. Additionally, I have been watching manufacturing hours and payrolls, to see if that white-hot sector was holding up in the face of supply bottlenecks. Also important are  whether there were continued gains in leisure and hospitality jobs, or whether Delta had caused those to stall. Both of these metrics also were very positive this month.

The 6 month average of monthly gains as of now is 665,000 - not bad at all! But we still have 4.2 million jobs to go to equal the number of employees in February 2020 just before the pandemic hit. If you are doing math, that’s about 7 more months at this rate.

Here’s my synopsis of the report:

HEADLINES:
  • 531,000 jobs added. Private sector jobs increased 604,000, but government (mainly education) shed -73,000 jobs, having a great deal to do with haywire seasonal adjustments this year, and specifically public education, which shed -65,000 jobs. The alternate, and more volatile measure in the household report indicated a gain of 142,000 jobs - a relatively poor number - which factors into the unemployment and underemployment rates below.
  • The total number of employed is still -4,204,000, or -2.8% below its pre-pandemic peak.  At this rate jobs have grown in the past 6 months (which have averaged 665,000 per month), it will take another 7 months for employment to completely recover.
  • U3 unemployment rate declined -0.2% to 4.6%, compared with the January 2020 low of 3.5%.
  • U6 underemployment rate declined -0.2% to 8.3%, compared with the January 2020 low of 6.9%.
  • Those not in the labor force at all, but who want a job now, rose 9,000 to 5.978 million, compared with 5.010 million in February 2020.
  • Those on temporary layoff decreased 68,000 to 1,056,000.
  • Permanent job losers declined -125,000 to 2,126,000.
  • August was revised upward by 117,000, while August was revised upward by 118,000, for a net gain of 235,000 jobs compared with previous reports.
Leading employment indicators of a slowdown or recession

These are leading sectors for the economy overall, and will help us gauge how strong the rebound from the pandemic will be.  These were positive:
  • the average manufacturing workweek, one of the 10 components of the Index of Leading Indicators, declined -0.1 hour to 40.3 hours.
  • Manufacturing jobs increased 60,000. Since the beginning of the pandemic, manufacturing has still lost -270,000 jobs, or -2.1% of the total.
  • Construction jobs increased 44,000. Since the beginning of the pandemic, -150,000 construction jobs have been lost, or -2.5% of the total.
  • Residential construction jobs, which are even more leading, rose by 1,800. Since the beginning of the pandemic, 45,100 jobs have been *gained* in this sector, or +5.4%.
  • temporary jobs rose by 41,000 - a huge gain! Since the beginning of the pandemic, there have still been 173,300 jobs lost, or -5.9% of all temporary jobs.
  • the number of people unemployed for 5 weeks or less decreased by -152,000 to 2,085,000, which is now *lower* than just before the pandemic hit.
  • Professional and business employment increased by 100,000, which is still -215,000, or about -1.0%, below its pre-pandemic peak.

Wages of non-managerial workers
  • Average Hourly Earnings for Production and Nonsupervisory Personnel: rose $0.10 to $26.26, which is a 5.8% YoY gain. This continues to be excellent news, considering that a huge number of low-wage workers have finally been recalled to work. 

Aggregate hours and wages:
  • the index of aggregate hours worked for non-managerial workers rose by 0.3%, which is a  loss of -2.5% since just before the pandemic.
  •  the index of aggregate payrolls for non-managerial workers rose by 0.7%, which is a gain of 6.7% (before inflation) since just before the pandemic.

Other significant data:
  • Leisure and hospitality jobs, which were the most hard-hit during the pandemic, gained 164,000 jobs, but are still -1,383,000, or -8.2% below their pre-pandemic peak.
  • Within the leisure and hospitality sector, food and drink establishments gained 119,400 jobs, and is still -784,300, or -6.4% below their pre-pandemic peak.
  • Full time jobs increased 279,000 in the household report.
  • Part time jobs increased 159,000 in the household report.
  • The number of job holders who were part time for economic reasons declined by -45,000 to 4,423,000, which is an increase of 25,000 since before the pandemic began.

SUMMARY

With the exception of the “relatively” poor gain of 142,000 in the more volatile household report (still up an average of 477,000/month over the past 6 months), the decline in education jobs (almost certainly due to seasonality issues caused by the pandemic), and a slight decline in the manufacturing workweek, everything about this report was positive to strongly positive.

To begin with, the last two reports got revised significantly higher. In fact August is now 248,000 higher than when first reported. The average gain for the last 6 months remains over 600,000. All of the leading jobs sectors showed gains. Both full time and part time employment showed gains. Involuntary part-time employment is virtually back to where it was before the pandemic hit. Wages for non-managerial workers continued to increase sharply. Those on temporary layoff are down to 2015-16 levels. 

There is still substantial ground to be made up. As indicated above, we are still 4.2 million jobs below where we were in February 2020. At the current rate, it will take until next May to make up the remaining difference. Total hours worked are still -2.5% below their pre-pandemic peak, and there are still about 750,000 more permanent job losers than there were before the pandemic hit.

This was a very good report, putting to rest many questions about whether the recovery was faltering. 

Thursday, November 4, 2021

Three reasons for the decline in Biden’s (and Democrats’) popularity


 - by New Deal democrat

Dan Guild follows presidential approval closely, and uses it to model election outcomes, including State level as well as Congressional and Senate races. He’s been very consistent, and very good.


For the past several months, his hair has been on fire about a real decline in Biden’s approval ratings, for example, here. He is particularly concerned about the big decline among young adults, who all but boycotted Tuesday’s State level elections.

So, why has Biden’s approval rating declined? There are three very good reasons, two of which are related to economics.

Let’s start with his inability to get his major economic program, “Build Back Better,” through Congress. 

Here’s an excellent graph comparing the last 4 Presidents’ first year in office:
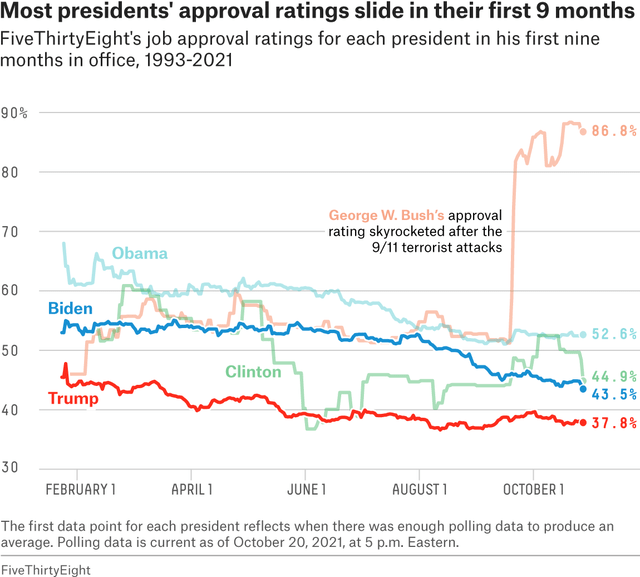

What is most noteworthy is that all 3 of the last Presidents have had similar trajectories, and for largely similar reasons. After initial success passing emergency stimulus, Obama’s Affordable Care Act was hopelessly mired in Congressional committees. Similarly, Trump was unable to “repeal and replace” Obamacare. 

When a President is completely stymied by Congress, their approval rating tanks.

Secondly, there’s the price of gas. Back in the George W. Bush Administration, there was a graph entitled “Presidential approval: it’s a gas, gas, gas” which persuasively showed that Bush’s approval rating closely correlated with the price of gas. Quite simply, people use the price of gas as an easy proxy for inflation (indeed, in my “Weekly Indicators” posts, the price of gas is a component of the “Miller Score” insofar as it helps measure the trade off between inflation and unemployment).

I recall that I occasionally noted that this heuristic continued in the Obama Presidency. His approval generally rose and fell with with price of gasoline as well.

So let’s update through the present. Below is the price of gasoline as a share of disposable personal income (blue) vs. consumer sentiment as measured by the University of Michigan (inverted, right scale, red):
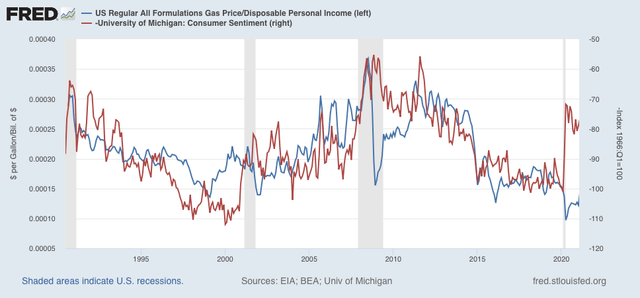

For the past 30 years, the two series track pretty well with the exception of periods right around recessions, where they tend to invert. That is to say, consumer sentiment generally falls as the price of gas rises, except when gas prices tank during recessions coincident with sentiment being at its worst.

Now here is the last two years, to focus on the pandemic:
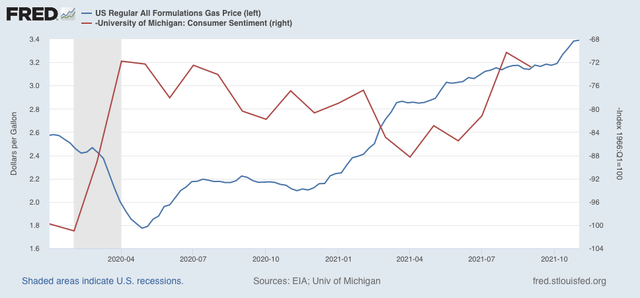

Beginning this past spring, gas prices and consumer confidence reverted to their normal configuration. The confidence numbers end with September, but October was actually a little worse, consistent with the continued rise in gas prices last month.

Consumers are noticing the pinch from gas prices, and it has influenced their opinions of Biden.

Finally, let’s turn to the one non-economic variable: the Delta wave.

Here is the last 6 months of US coronavirus infections per capita:
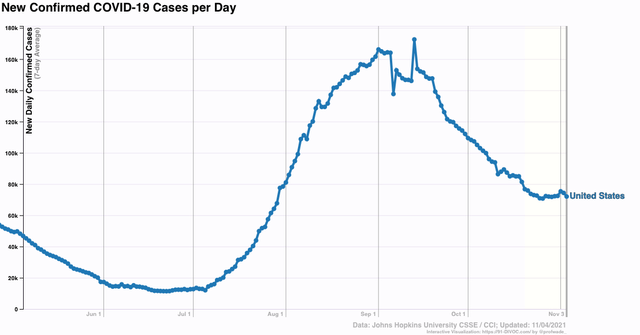

As you probably already recall, with vaccines the number of cases fell precipitously this past spring, to a low point of 11,300/day in late June. From that point until Labor Day, the Delta wave hit like a tsunami as case rose sharply to over 160,000/day. In the two months since, only half of that increase has been taken back by the Delta wave rolling out, as the US is still averaging over 70,000 cases/day.

I think the 3 above reasons are a succinct and accurate summary of the reasons for the decline in Biden’s popularity, and a reason why Election Day did not go so well for Democrats (in addition to the simple behavioral fact that anger is a much stronger motivator for voting than gratitude, a factor in all off-year elections). 

If inflation abates (likely), COVID cases decline (likely with increased vaccinations and more resistance due to higher numbers of previous infections), and Biden is able to get the Build Back Better reconciliation through Congress (?????), then Democrats are going to be - relatively speaking - in better shape for the 2022 midterms.
Layoffs, wages, and labor costs: three measures of the labor Boom


 - by New Deal democrat

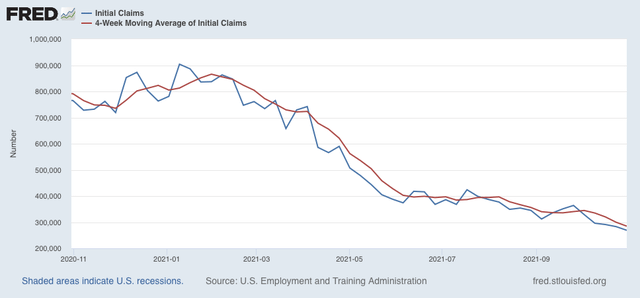
Initial claims declined another 14,000 this week to 269,000, and the 4 week average declined 15,000 to 284,750, both new pandemic lows:


For the past 50 years, initial claims have only been at these levels briefly at the peak of the late 1990’s tech boom, and from 2015 to just before the pandemic in 2020.

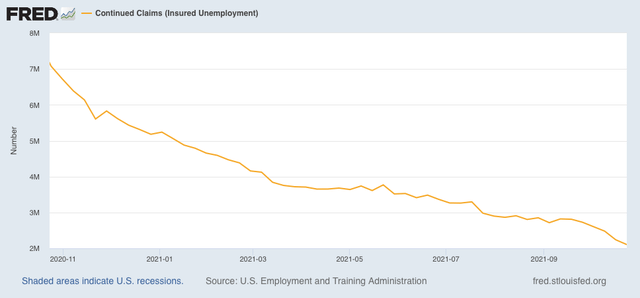
Continuing claims also declined 134,000 to 2,105,000, also a new pandemic low:


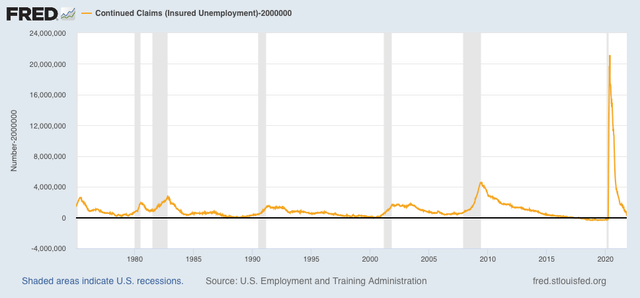
This is very close to the cutoff line of 2,000,000 which has epitomized peak economic expansions in the past 50 years, as shown in the below graph which subtracts 2,000,000 from the reported numbers:


For all intents and purposes, nobody is getting laid off.

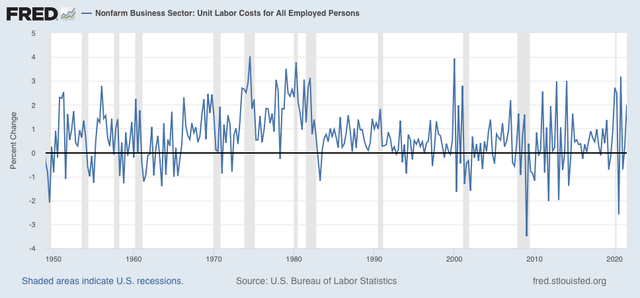
This tightness in the labor market means that workers are also commanding a bigger share of the fruits of their labor.  Unit labor costs (how much compensation has to be paid workers per unit of output) increased 2.0% in Q3 alone. This level of increase only occurred 7 times between the modern labor era dating to 1982 and the pandemic:


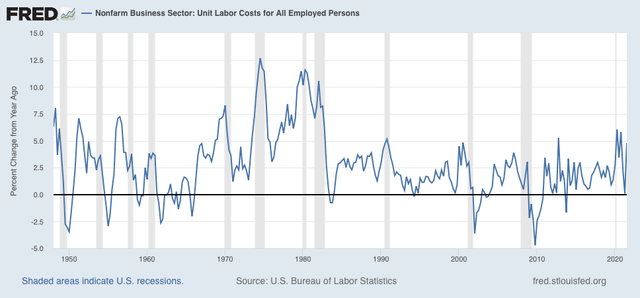
YoY unit labor costs are up 4.8%, which only occurred 4 times since 1982 before the pandemic:


While in the financial press unit labor costs are frequently bemoaned because they lessen potential profits to companies, since laborers have been largely cut out of productivity improvements since trade with China was opened in 1999, any return to a more equitable share is a good thing.

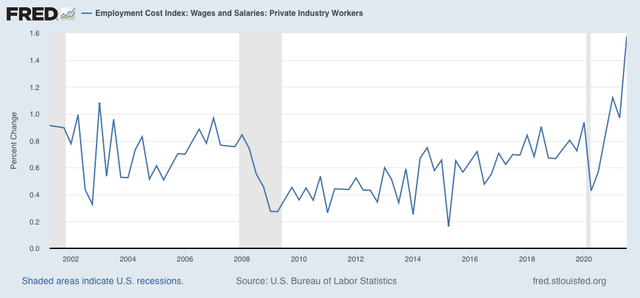
Finally, the employment cost index was reported for Q3 one week ago. I didn’t note it then, but it also showed labor costs increasing sharply, a new record at a 1.6% increase in one quarter alone:


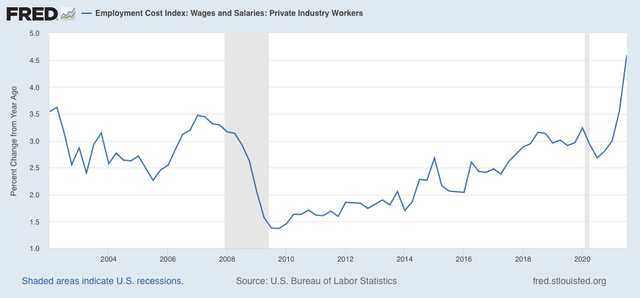
The YoY increase of 4.6% was also a record:


What is noteworthy about the ECI is that it tracks compensation *normalized for the type of job,* i.e., it isn’t influenced by a different mix of high wage vs. low wage jobs. Dishwashers are compared with dishwashers, and so on.

The recovery from the pandemic has been the best time to be a worker since the late 1990s Boom.


Wednesday, November 3, 2021

October vehicle sales give sharply mixed message about the economy going forward


 - by New Deal democrat

Ok, FRED is back up and running, so here is my economic post of the day.


Vehicle sales used to be reported monthly by all manufacturers. Then, one by one, they switched to reporting only once a quarter, which makes their data much less interesting, since it is largely 90 days old by the time it is available. Not terribly helpful for looking ahead.

But the BEA also reports vehicle sales monthly, although for reasons unknown FRED does not post them until 4 weeks later.

Which is a too-lengthy introduction to saying that the BEA has reported October results, although the FRED graphs below only show through September.

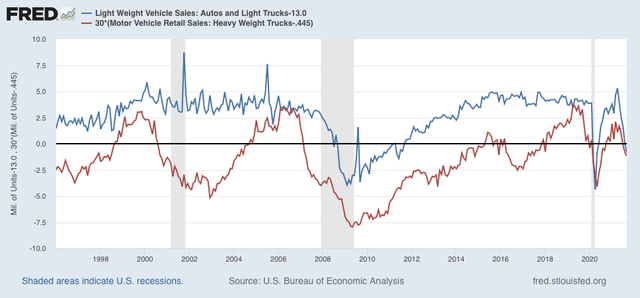
In October both light vehicle and heavy duty truck sales were up vs. September, the former to 13.0 million units annualized, and the latter to 0.445 million units annualized. The below graph subtracts that amount from each so that it shows as zero (and truck sales are multiplied x30 for scale):


There have been significant declines in both car and truck sales this year. Light vehicle sales peaked at 18.3 million annualized in April, and truck sales at 0.515 million annualized in March.

The reading is mixed. In the past, heavy truck sales have been a much earlier and more reliable leading indicator for a recession. This year they have not declined by nearly so much as prior to other recessions. Meanwhile light vehicle sales, which are typically very noisy, have declined by much more than is usually the case before a recession.

We know that much of this decline is due to the inability of manufacturers to get all the parts they require. This in turn has driven up prices sharply, which has caused a decline in sales as well.

I read this as showing that there is little economic stress on the producer side of the economy (that purchases heavy trucks); but there will be ramifications on vehicle manufacturers that will ripple through the economy. Overall I do not read this as recessionary - at least not at this point. As with last month, this Friday’s jobs report should be watched for both the number of jobs and hours added or lost in the manufacturing sector.

About last night


 - by New Deal democrat

I was going to write about motor vehicle sales (not good), but FRED is down for maintenance. I might put something up later whenever the site comes back online. 

In the meantime, because a few people have asked me offline what I make of last nights results (at least in Virginia), so herewith is my take.

Virginia turned out about exactly how I expected. The RWers are as pi**ed as progressives were 2 and 4 years ago, so they were going to turn out more. And as soon as McAuliffe dissed parents’ right to have a say in the education of their children, I knew he was sunk, and would probably take down the rest of the ticket.

But here is the more extended discussion. There were a few main factors, uniquely local, overlaid with a typical off-year electoral trend.

There were two national factors:

1. People are motivated much more strongly to vote by anger over something that they feel has been taken away from them, than gratitude for something they feel has been given to them. This is basic human behavioral wiring. That’s why the out-party typically does well in off year elections. And courtesy of Fox and Facebook, RWers were thoroughly wound up. Which is why NJ is also so close. (Dems will have the same incandescent rage - regrettably - one year from now after the Supreme Court overrules Roe v. Wade.)

2. Manchin and Sinema have done some real damage to national Dems. Here Biden is, going on one year in office, and he still can’t get his main agenda out of Congress. This is similar to 2009-10 and Obamacare, when centrist Dems like Baucus and LIeberman slow-walked it nearly to death. It is also similar to what happened to the GOP four years ago, when Trump failed to get a repeal of Obamacare through the Congress. Trump had among his worst ratings ever right after McCain’s thumbs-down.
But there were several decisive factors unique to VA:

1. McAuliffe’s gaffe at the last debate saying parents shouldn’t have any control over their childrens’ education. Even if you think that statement is true, it was a disaster to say it. A million parents heard “F*** you, we’re going to control your children.” Up until that statement, all the polls showed McAuliffe ahead (despite the background national issues above, and including Afghanistan and whatever other extraneous event you want to include. McAuliffe was still winning). As soon as that statement got publicized, his polls all tanked, and continued that way.

2. McAuliffe ran Hillary’s 2016 anti-Trump campaign, and got Hillary’s 2016 result. This is in contrast to the last two off-year elections, where Democrats ran against the votes cast by GOP legislators in the Statehouse. And none of the candidates touted the good things Statewide Dems had done for people in the last 2 years.

In short, take away the gaffe, and run a campaign focused on the State, and VA Dems might have overcome the adverse national trends.

Tuesday, November 2, 2021

Coronavirus dashboard for November 2: the winter wave has begun


 - by New Deal democrat

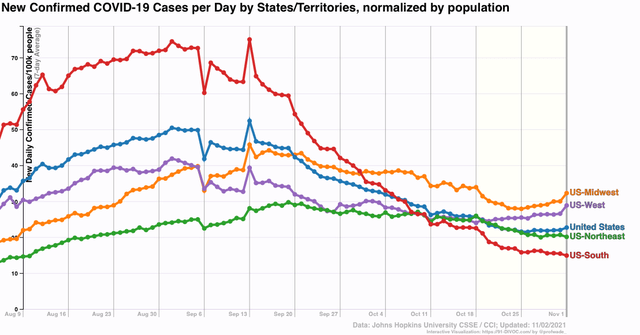
The Delta decline is probably over. Nationwide US cases are up 4000/day from one week ago. The Northeast and South census regions still show a decline, but West and Midwest regions show increases: 


One week ago only 3 States were in the “increasing” category. Now the increasing trend States include: NJ, AL, CA, NV, AZ, CO, NM, ND, SD, MI, MN, IA, and NE. There are also slight increases in NY, RI, IN, and WI.

Some States still show declines: AK, VT, NH, PA, CT, WV, KY, DE, NC, SC, AR, FL, GA, MT, OK, TX, and WY.

The declines are almost all in the warmest States + those with the most recent outbreaks. The increases are with few exceptions in the colder States.

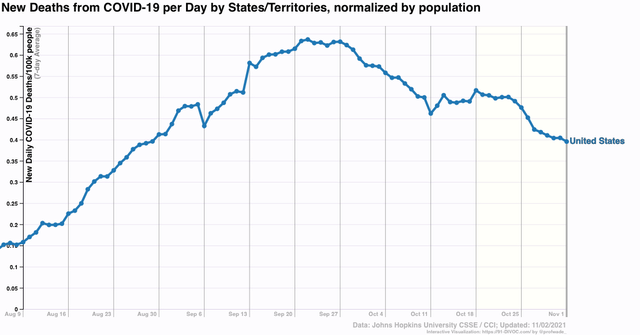
On the plus side, deaths are down 35% from the Delta peak into the middle of the “normal” range for this pandemic:


The winter wave has almost certainly begun.

But as of yesterday 80% of all US adults had at least one shot, and later this week we will probably cross the threshold of 70% of all US adults completely vaccinated. Including those age 12 and up the respective numbers are 78% and 68%. We can expect lots of younger school age children to have at least one shot before Thanksgiving, and be fully vaccinated by Christmas.

Plus, on average (with plenty of variation) being infected recently almost certainly conveys some resistance to reinfection - and in the past 4 months about 4% of all Americans had *confirmed* cases, most likely meaning that close to 10% were *actually* infected. 

Put that together, and there are significantly fewer people susceptible to infection at present than there were 4 or 12 months ago, so I strongly suspect this winter’s wave will not be as bad as either last winter’s, or Delta.

Monday, November 1, 2021

Manufacturing remained strong in October, while construction spending declined in September (but not yet at recessionary levels)


 - by New Deal democrat

As usual, we started out the month with the forward-looking ISM manufacturing report for October, as well as construction spending for September.


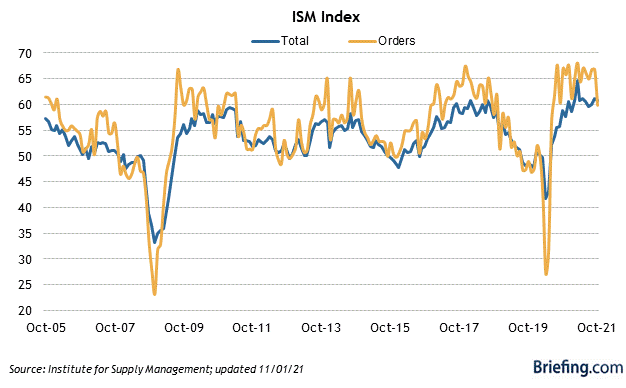
Let’s take the ISM report first, since it is an important short leading indicator for the production sector. Here the total index declined slightly - mere -03 - to 60.8, and the more leading new orders subindex declined sharply - by -6.9 to 59.8:


Since the break even point between increasing and decreasing numbers of respondents, both of October’s numbers in fact show strong expansion - in the case of new orders, simply not nearly so strong as in most of the last 12 months. In short, still quite positive.

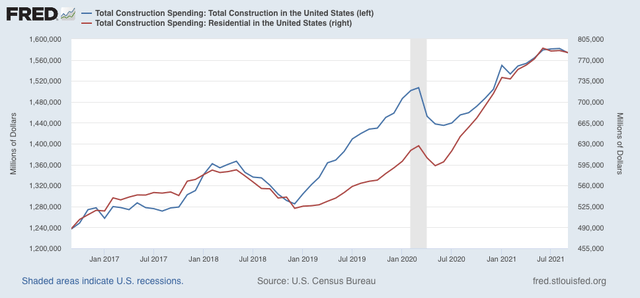
Turning to construction, in nominal terms overall spending including all types of construction declined -0.5%, while spending on the leading residential sector declined  -0.4%, but still at levels very close to their all-time highs:


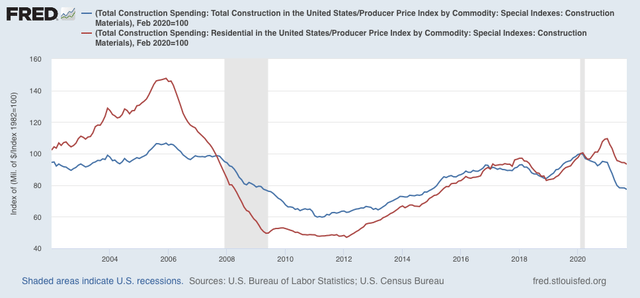
Adjusting for price changes in construction materials, which jumped by 0.7% in September, “real” construction spending declined -1.3%m/m, and “real” residential construction spending declined -1.1%. In absolute terms, “real” construction spending has declined sharply earlier this year, although there has been relative stabilization in the last few months:


“Real” total construction spending has now declined -18.7% since its post-recession peak in November 2020, while “real” residential construction spending has declined -14.8% since its post-recession peak in January of this year.

The above shows that, while total construction spending has declined by more than it had before the Great Recession, the decline in residential construction spending, while substantial, is nowhere near the big decline it suffered before the end of 2007 in this series that only dates from 2002.

This gives us essentially the same message that we got from single family housing permits several weeks ago: there has been a big decline in this long leading sector, but not yet what would typically precede a recession.