Saturday, May 7, 2011

Weekend diversion: Japan tectonic shift infoporn

- by New Deal democrat

I'm a sucker for science and for infoporn, so I found the below two images really interesting.

The first shows the location of all earthquakes near Japan beginning just before the March 11 megaquake. It's really easy to see exactly how big a portion of the earth's crust shifted:


The large plurality of aftershocks in the last few weeks have been at the southwest edge of the wedge shown above, so I guess we know where the increased pressure is accumulating next. (To see this in time-lapse, google "Japan quake map:).

The second image shows how far each section of the above wedge moved (see index at lower right). The larger dark red dots are the locations and intensities of various aftershocks:


The biggest move appears to have been about 80 feet!

Weekly Indicators: Commodities Crash Edition

- by New Deal democrat

The big monthly news released this week was continued growth in nonfarm payrolls, up 244,000 in April. February and March were also revised higher. That makes 15 out the last 16 months that initial estimates have been revised upward. The household survey showed a decline of 191,000 jobs, so the unemployment rate went back up to 9.0%. Signifcantly, temporary hiring declined, while construction employment remained steady. While manufacturing continued strong, via the ISM manufacturing index, the ISM non-manufacturing index slipped sharply. Income and spending for April were reported higher, as were monthly same store sales.

Despite the good April payroll news, I sincerely hope that readers of this blog were not surprised by the several suddenly punk reports this past week. Back in January I said that I expected the economy to stall in the second and third quarters due to Oil and Austerian stupidity. Week after week for at least three months in this column I have been reporting the slowly deteriorating YoY numbers in many indices. This week the MSM's complacency was finally broken. So was the speculative surge in several commodities, most especially silver - which caused Oil to back off 10% in a single week. For the next several months I expect to be chronicling the coincident damage, while we wait to see how long it takes high prices to cure high prices, and how much Austerian stupidity emanates from Versailles.

So, turning to the high-frequency weekly indicators:

As indicated above, Oil started the week over $110 but finished at about $97.50 a barrel by Friday. Nevertheless, it still remains slightly above 4% of GDP. Gas at the pump increased $.08 more to $3.96 a gallon - with the exception of 8 weeks in 2008, an all time high. Gas prices have gone up over $1 a gallon in less than 5 months. Gasoline usage at 8943 M gallons was 2.3% lower than last year's 9148. This YoY comparison has been negative for the last eight weeks in a row, averaging -1.6% for the last six weeks. If this level of decline continues for another month, that will be equivalent to the decline near the end of 2007. If we continue to get more poor economic data, expect the declines in Oil prices to stick around for a little while.

The BLS reported that Initial jobless claims last week were 474,000. The four week average is now 431, 250. Needless to say, this was awful, and no it can't all be put at the feet of bus drivers laid off one week for spring break.

Railfax was up 3.3% YoY. Baseline traffic remains below last year's levels. On a 4-week average basis, Cyclical traffic is now also barely above last year's levels. Auto shipments are also down YoY (this may be related to the earthquake in Japan). Even intermodal traffic's YoY advance is at a low ebb, as is total traffic.

The Mortgage Bankers' Association reported an increase of 0.3% in seasonally adjusted mortgage applications last week. Refinancing increased 6.0%, preumably refelcting a decline in mortgage rates. It remains above its June-July 2010 lows. The purchase series has been generally flat for close to one full year - compared with its previous relentless decline, a good thing.

The American Staffing Association Index remained at 92 for the fifth week in a row, after stalling at he 90-91 level for 7 weeks. If this series does not pick up significantly in the next few weeks, it will mirror its flatness in early 2008 and 2009.

The ICSC reported that same store sales for the week of April 30 rose 2.8% YoY, and increased 0.8% week over week. Shoppertrak reported a 6.0% YoY decrease for the week ending April 30. It also reported a WoW decrease of 16.0% (reversing last week's big gain due to Easter). Calendar affects continued to strongly affect these results, but this is still the biggest YoY decline in a very long time for Shoppertrak.

Weekly BAA commercial bond rates decreased .05% to 5.93%. This equals the .05% decrease in the yields of 10 year treasuries to 3.36%. There remains no sign of corporate distress here, although there is a small tinge of fears of deflation (due to the commodity crash).

Adjusting +1.07% due to the 2011 tax compromise, the Daily Treasury Statement showed that for the first 4 days in May 2011, $37.0 B was collected vs. $36.7 B a year ago, for an increase of $0.3 B YoY. For the last 20 days, $132.9 B was collected vs. $130.1 B a year ago, for an increase of $2.8 B, or 2.2%. Use this series with extra caution because the adjustment for the withholding tax compromise is only a best guess, and may be significantly incorrect.

M1 was up 2.8% w/w, up 0.9% M/M, and up 11.6% YoY, so Real M1 is up 8.9%. M2 was up .3% w/w, up 0.4% M/M and up 4.9% YoY, so Real M2 is up 2.2%. Although Real M1 is still strongly in the "green zone" where it has been since before the end of the "great recession," Real M2 has faded back into the "yellow zone" below 2.5%.

We have a number of indices - Railfax, American Staffing Association, initial claims - that are stalling or worse. Still, both Real M1 and the holding steady of mortgage applications continue to say no outright downturn.

Have a nice weekend!

Friday, May 6, 2011

Weekend Weimar and Beagle

It's been awhile -- but here are some pictures of the kids


A note about the commodities crash

- by New Deal democrat

Some of you may have noticed, commodities have crashed in the last week. Oil went from over $114 to about $97 earlier this morning. According to Bespoke Investments, this is the most serious crash since 1980 (when the Hunt Brothers' attempt to corner the silver market imploded).

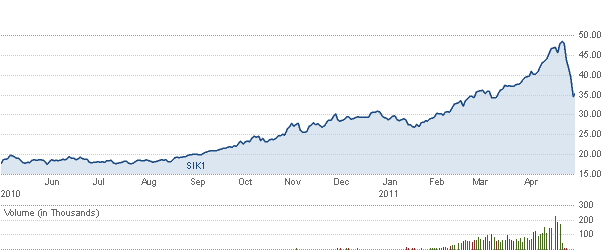
Most likely, this crash too goes back to the silver market, which has had a150%+ parabolic move in the last year, from about $18/ounce to just under $50:


There have been substantial allegations of manipulation made (as in, ETFs that are supposed to hold actual bullion, instead holding vapor). Margin requirements have been raised 4x in 8 days.

As of the end of yesterday, silver was off 30% in a single week. Gold was off about 7%. Oil was off almost 10%.

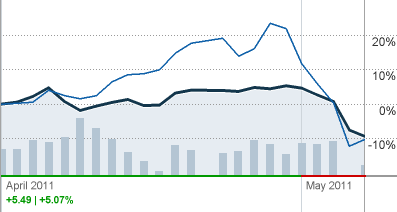
Note, however, that while Oil and some other commodities made tops on the same day as silver (last Thursday), their declines were very orderly until AFTER silver crashed. For example, here's Oil:


Note that the big move in Oil comes on the third day of the silver crash.

That suggests to me that people who were caught flatfooted by silver's move, and had margin calls, had no choice but to cash out other commodity positions to meet the calls. A similar thing happened with hedge fund redemptions in early October 2008 causing stocks to crash.

One important difference is, volumes in Oil futures have been rising, while silver's have been almost non-existent. I don't know what to make of that anomaly.

Usually when bubbles pop, the entire parabolic move is given back, although not necessarily all at once. If Oil positions continue to be cashed out, we could see Oil back at about $85. Which would, of course, be good for the economy.

The cure for high prices continues to be . . . high prices.

P.S. Due to the necessity of earning a living, Weekly Indicators will go up tomorrow. There will also be a double-special weekend diversion!

Payrolls Up +244,000

From Bloomberg:

The U.S. economy added more jobs than forecast in April, easing concern that higher fuel prices are slowing the economic recovery.

Payrolls increased by 244,000 workers last month, the biggest gain since May 2010, after a revised 221,000 gain the prior month, the Labor Department said today in Washington. Economists projected an April rise of 185,000, according to the median estimate in a Bloomberg News survey. Employment excluding government jobs jumped the most in five years. The jobless rate rose to 9 percent, the first increase since November.

More jobs and rising wages may give households, whose spending accounts for 70 percent of the economy, the means to overcome the highest gasoline prices in almost three years. Federal Reserve Chairman Ben S. Bernanke and some of his colleagues have signaled they plan to forge ahead through June with record monetary stimulus to bolster the expansion.

“The recovery has progressed into the self-propelling stage, where it’s less vulnerable to short-term swings in sentiment,” said Jim O’Sullivan, chief economist at MF Global Inc. in New York, who forecast a gain of 250,000 jobs.

On a personal note -- I am very relieved by this report. The events of the last few days have been very concerning, with the rise in initial unemployment claims particularly being particularly hair-raising. This goes a long-way to arguing that what we're seeing are temporary fluctuations.

NDD here with a few comments:

- Unemployment ticked up .2% because the household survey showed 190,000 jobs *lost*.

- Manfuacturing workweek, a leading indicator, was unchanged.

- Private payrolls were up 268,000. Government jobs continue to slowly bleed.

- Construction jobs were unchanged. That area of hemorrhaging is over.

- Perhaps most importantly of all, February and March were both revised upward, by a total of 47,000. This continues the pattern of relentless upward revisions. In the last three months, job gains have averaged 233,000. Not jumping for joy numbers, but not bad at all either.

- Since nonfarm payrolls are the quintessential coincident indicator, and initial jobless claims are leading, unlike Bonddad these do not alleviate my concern about the next few months. For that, we need Oil to decline - anybody heard anything about that?


Thursday, May 5, 2011

Friday Dollar Analysis

Last week I wrote the following about the dollar:

Given the above charts, and the fact nothing has fundamentally changed in the big picture for the dollar, my assessment of the dollar market for the coming week is the exact same as it was for last week: more moves lower with rebounds into the EMAs providing upside resistance


The dollar may be in a position for a technical rebound. Last week there was very little action lower, with prices instead moving in a rounding pattern. There has been a large volume spike over the last week, which may be the sign of a selling climax. Also note the gap higher today and the very strong candle print. There was a strong fundamental reason for the change of direction: dovish statements from the ECB regarding interest rates. I'm suspecting that some of today's action was also some short covering.


So far, the technical indicators are not giving a strong confirmation of a rebound trade. While the A/D and CMF have spiked up, these increases are still new and therefore still possibly transitory. In addition, the MACD is still giving as a neutral reading at best.

The idea of a rebound trade does not mean that the fundamental downward trend that is in place is in any danger of being broken. Prices have still moved through important long-term support levels indicating a strong move lower is already taking place. What is happening is a simple "profit taking" of the shorts. Given the underlying interest rate and fundamental issues underlying each currency, I don't see any reason to the dollar is in danger of a strong rally at this point. But, if you're shorting the market, I would consider taking some profits off the table right now.

Are Emerging Markets Giving the US a Sell Sign?


Let's assume that demand from emerging economies is a primary driver of the current expansion. Let's also assume that stock markets are leading indicators; as traders see the increased possibility of economic growth, they bid up shares in anticipation of increased earnings. Given those two assumptions, let's take a look at three emerging market ETFs.


Brazil has a sideways bias with prices stuck in a roughly 10 point range (70 to 80). The longer term trend (the 200 day EMA) is still higher, but the EMAs are now jumbled; the 10 and 20 day EMAs are moving lower and the 10 day EMA has crossed below the 10. Also note that prices have fallen sharply this week and are now right about the 200 day EMA.


The China ETF has a very similar profile the the India ETF. Most importantly, note that prices are gravitating around the 200 day EMA.


Over the last six months, the India ETF's prices have a slight downward bias, although the 200 day EMA is in a more or less sideways move. All the shorter EMAs recently moved about the 200 day EMA, but are now all moving lower with the 10 day EMA below the 20 and abo0ut to move below the 50.

All of these ETFS are at best showing a "wait and see" attitude regarding their underlying economy. As such, we should pay attention for the possible implications for the US market.

How Oil's choke hold on the economy will end

- by New Deal democrat

For the second time in two years, Oil's choke hold on the economy is asserting itself. Acceleration in recovery causes acceleration of demand, and acceleration of Oil prices - which causes the economy to stall. That choke hold won't go on forever, though. There are three forces that will combine to bring it to an end: alternate fuels, conservation, and exploration.

1. Alternate fuels and technology

Perhaps the most promising alternate fuel to oil is natural gas. According to the EIA, natural gas reserves increased 11.3% in 2010. Nautral gas exploration in the northeeastern US, Texas, and North Dakota is proceeding robustly, and we can expect natural gas usage to increase over the next decade.

In addition to natural gas, alternate technology in the form of hybrid vehicles is finally making up a small but significant share of vehicle sales. In 2010, hybrid vehicles made up ~2.5% of all vehicles sold. As gasoline prices have continued to increase, in the first three months of 2011:
Growth in highly fuel-efficient vehicles far outpaced the rest of the market.

In the first quarter of 2011, hybrids increased sales by 33.9 percent, while the overall market grew by 20.2 percent. In March, small cars— such as the Ford Fiesta and Honda Fit—grew at almost twice the rate of the overall market, 30 percent compared to 17 percent.
...
Hybrids and small cars are even bigger in the used car market.
Although this probably only means an increase to 2.7% of all vehicles so far, looking further out into the future, the recently released J.D. Power and Associates 2011 US Green Automotive Study
indicates major growth in consumer interest in green cars—including hybrids, clean diesel, plug-in hybrids and pure electric cars. The market research firm expects as much as 10 percent of sales to come from vehicles with these fuel-efficient technologies by 2016. That would represent a four-fold increase in the sales numbers for green cars
If $4 gasoliine becomes the norm, I suspect that estimate may be substantially to the low side.

2. Conservation

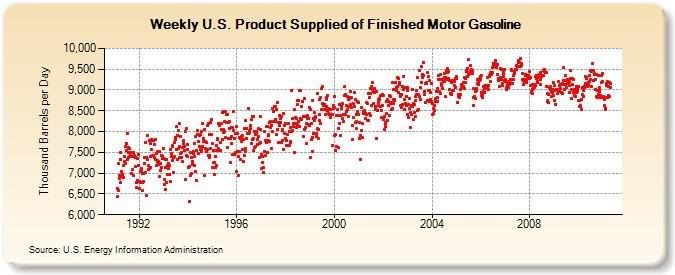
The fact is that the 2008 Oil spike and the "great recession" have left a substantial dent in US Oil consumption, as shown in this graph of weekly usage:


Continuing high gas prices are once again having an impact an auto buying. While April as a whole logged in at 13.1 M vehicles sold on an annualized basis, the Detroit News reported that:

April started strong, but took a dive as gas prices spiked, storms ravaged the Midwest and South, and parts supply shortages in earthquake-stricken Japan squeezed new car and truck inventories, analysts say.
Furthermore, as I noted above, there has been a marked shift not just to hybrid vehicles, but also to smaller, more fuel efficient models.

Over the short term, demand for fuel is inelastic, but over the longer term we can see that people do adopt strategies to conserve energy usage in the face of high prices. As in 2008, high gas prices are causing an increase in the use of mass transit. For example, in the Miami, FL area mass transit usage is up 11% compared with last year. Other areas, such as Philadelphia, have shown similar increases.

3. Exploration

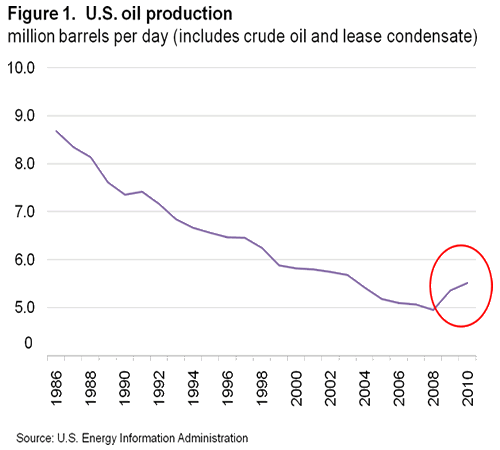
In addition to opening up natural gas exploration, $100 Oil is causing renewed drilling for Oil in areas where it was previously unprofitable. As a result, US Oil production has actually increased in the last two years:


Additionally, deep water drilling in places like offshore Brazil, have led to discoveries such as this one noted in 2009:

Brasileiro SA, Brazil's state-controlled oil company, says its tests show the Guara deepwater offshore field holds between 1.1 billion and 2 billion barrels of oil and initial production may start in 2012 with 50,000 barrels of oil equivalent a day.
This deposit, known as the Guara field, is scheduled
to start pilot production in early 2013 at a rate of 120,000 barrels a day of oil and 5 million cubic meters a day of natural gas,
, according to Petrobras.

As the Wall Street Journal reported in 2009:

When this is added to the Tupi and Lara fields recently found by the Brazilian oil giant Petrobras, the total yield could be close to 12 billion barrels. It has been years since deposits of this size have been found anywhere.
The same article in 2009 reported on another huge find that has since taken on another significance:

BP (BP) last week said it found an oil field deep under the Gulf of Mexico that could yield as much as one billion barrels of oil and gas.
Yes, I think we know about that last "gusher."

In Summary, however, the Oil choke hold on the economy will not last forever. I claim no clairvoyange, but a good guess is that by 2013 or 2014, the combination of alternative fuels and technology, conservation, and exploration will relieve the current situation.

Initial Claims Scaring the Heck Out of Me

From Marketwatch:
The number of people who filed new applications for jobless benefits leaped 43,000 last week to 474,000, the highest level in almost nine months. A Labor official attributed much of the increase to temporary layoffs in the auto sector and in the state of New York, where workers in the educational field such as bus drivers are eligible for compensation during the week of spring break. Economists surveyed by MarketWatch had expected claims to fall to seasonally adjusted 412,000 from the prior week's revised level of 431,000. The average of new claims over the past four weeks, meanwhile, climbed by 22,250 to 431,250, the highest level since November. The four-week average is considered more accurate a gauge of employment trends because it lessens week-to-week volatility in the data. Also, the government said the number of workers who continue to receive state compensation increased by 74,000 to a seasonally adjusted 3.73 million in the week of April 23. Altogether, 8.01 million people received some kind of state or federal benefit in the week of April 16, down 171,547 from the prior week
This is clearly a major move in the wrong direction. More importantly, a jump like this is a signal of a huge slowdown coming. In short -- not good, not good at all.

Wednesday, May 4, 2011

Thursday Oil Market Round-Up

Last week I wrote the following about the oil market:
This week, I'm still left with the feeling that traders are sensitive to the overall price of gas. In addition, consider the fact that the oil market has not advanced due to the ongoing problems in the Middle East. And, we're starting to get word of decreased gasoline demand and a possible slowing economy in Q1.

While my feeling is not scientific, I'm still of the opinion there is not much upside room in the oil market, given gas' current price.
Let's take a look at the chart to see what it tells us:


Prices have hit strong resistance at the 114 price level. First, notice that as prices rallied to that level from the middle of April, they printed some very weak bars. When prices hit the 112 level, they printed several spinning tops and candles with weak bodies. Also of interest is the MACD which printed some very weak readings. While the EMA picture was strong, there was also the fundamental picture; gas is approaching $4/gallon, which is clearly having an impact on consumer behavior.

As such, we see that prices have again retreated from the 114 level, printing some strong downward bars. Let me add that I do not expect prices to crash; there is still very strong upward pressure from simple supply and demand. World oil supplies are tight, demand -- although weakening -- is still strong, the Middle East is still a tinderbox and we're entering the summer driving season in the US. Those facts provide strong support for prices.

In short, I don't see the market moving strongly in either direction. As prices approach the 114 level, I see them hitting resistance, especially as news of gas prices gets publicity. However, there are strong supports for the market as well.

Basically, I think we're in for a fairly tight trading range near term.

Is Manufacturing Out of the Woods?

Last week, I noted that three regional Fed manufacturing surveys had printed lower numbers in their latest reading. As I described it, the breadth of the data was concerning. This week we have two more data points to analyze.

From the ISM:

"The recent trend of rapid growth in the manufacturing sector continued in April as the PMI registered above 60 percent for the fourth consecutive month. The New Orders and Production Indexes continue to drive the PMI, as they have both exceeded 60 percent for five consecutive months. Manufacturing employment appears to have developed significant momentum, as the Employment Index readings for the first four months of 2011 are the highest readings in the last 38 years. Inventory growth also took place in April after two months of destocking; however, the inventory restocking would appear to be necessitated by the strong performance in new orders. While the manufacturing sector is definitely performing above most expectations so far in 2011, manufacturers are experiencing significant cost pressures from commodities and other inputs."


While this data point is lower than the preceding months, the reading is still very good alleviates some of my concern. 17 of the 18 industries reporting were showing growth, with the only laggard being furniture.

Here is what respondents said:


  • "Rapidly rising raw material costs putting extreme pressure on profits." (Food, Beverage & Tobacco Products)
  • "Plastic resin product prices are climbing so fast that [suppliers] are attempting to increase prices on orders already accepted but not [yet] delivered." (Chemical Products)
  • "Customers are rebuilding safety stock levels of inventory, and also trying to buy ahead of material price increases." (Plastics & Rubber Products)
  • "Market continues to get stronger month over month. Recovery is faster than anticipated." (Transportation Equipment)
  • "Pressure from offshore suppliers continues to mount with exchange rate increases and seasonal demand for capacity." (Miscellaneous Manufacturing)
One interesting point is that people and firms appear to be stocking up on supplies in anticipation of further price increases. That tells us that some of the current activity is probably speculative in nature. It also means manufacturers are probably getting squeezed by the increases and are looking to pass on some of those increases in higher prices if possible.

However, the overall report is still very strong and indicates manufacturing appears to be in good shape.

Factory orders also printed a strong number:

U.S. factory orders surged in March, posting a fifth straight monthly increase that showed a healthy manufacturing sector well placed to support economic recovery.

The Commerce Department said on Tuesday new orders for manufactured goods rose 3 percent to a seasonally adjusted $463 billion, well above Wall Street economists' forecasts for a 1.9 percent pickup.

In addition, February orders that had been reported as dropping by 0.1 percent were sharply revised to instead show a 0.7 percent increase.

A cheaper U.S. dollar has helped export industries and there are signs that producers are boosting investment in plants and equipment to benefit from it.

Orders for costly durable goods, items designed to last three years or more, were up 2.9 percent in March, the department said, an upward revision from a 2.5 percent gain it had earlier reported.

Financial markets showed no response to the data.

Orders for nondefense capital goods excluding aircraft -- often taken as an indicator of businesses' future investment plans -- were revised to show a 4.1 percent rise in March instead of a 3.7 percent gain. That followed a 0.9 percent increase in February.

The above reports help to alleviate my concern as they add more evidence to the argument that recent weakness is simply a blip.

David Leonhardt understands classical conditioning

- by New Deal democrat

On Monday I said:

I have argued . . . that [last summer’s slowdown] was a classic case of classic psychological conditioning. Dog hears bell, dog receives shock. The next time the dog hears the bell, it cringes, anticipating a shock. Last spring the Euro crisis recapitulated the early stages of the 2008 financial crisis. LIBOR rates surged. Businesses and consumers froze, fearing a repeat of 2008. (It also didn't help that Americans could see live video, 24/7, of a potentially cataclysmic Oil volcano erupting on the bottom of the Gulf of Mexico). The economy stalled. When the Euro crisis abated (and the well was capped), the economy unfroze.
Via Prof. Brad Delong, today we learn that David Leonhardt of the NY Times says:

Crises do so much damage that they leave businesses and households predisposed to believe the worst and to pull back at the first hint of economic weakness. Households are slow to resume spending. Banks are slow to lend, especially to small businesses. Companies are slow to hire.
Ding! Ding! Ding!

Economics really needs to understand, in dynamic fashion, classical and operant conditioning.

The Great Depression, Part 3

I want to continue with a look at the Great Depression from another angle, which is the percent the annual BEA data in a "contributions to percent change in GDP" format. This allows us to see what areas of the economy contributed to growth during a particular year.


The years 1930-1933 show a clear and devastating economic contraction. GDP dropped by 8.6%, 6.5% and 11.1% in the years 1930-1932 and a milder 1.3% in 1933. Most importantly, notice that literally all sectors of the economy are responsible for this contraction; PCEs and gross private domestic investment all decreased at sharp rates in 1930-1932. However, notice that government spending did little to stave off the decline; while it contributed to overall growth (that is it printed a positive number in the above chart) it did not add much. But while government spending did increase 10.2% in 1930, it only increased 4.2% in 1931 and contracted in both 1932 and 1933 (dropping 3.3% in both years from their previous years levels). As such, the lack of a contribution was the result of an unsustained fiscal stimulus effort.


The years 1934-1937 show a very different economy -- one of very strong growth. For the years 1934-1937, GDP grew 10.9%, 8.9%, 13% and 5.1% respectively -- all very healthy rates of growth. Most importantly, notice the increase was primarily the result of private sector factors with both PCEs and gross private investment adding to growth. Government spending did help, but this was hardly the public sector takeover many claim existed. However, also note that government spending did increase in these years (increasing 12.8%, 2.7% and 16.7% for the years 1934-1936, respectively) helping to add to economic growth (remember the GDP equation of C+I+X+G).


1937 brought a recession to the economy, which led to another contract. Notice that -- once again -- this led to a drop in PCEs and investment. However, by 1938 growth had returned.

Contra an Oil shock recession

- by New Deal democrat

A couple of weeks ago, I made the case that the Oil shock of 2011 had begun. Consumer confidence, on cue, had suddenly decreased. Buyers changed to more fuel efficient autos. Yesterday brought word that April auto sales totalled 13.1 M units annualized, slightly higher than in March but lower than February, meaning that vehicle sales have essentially flatlined for the last 3 months.

At least one more signature of an imminent slowdown was released in the first quarter GDP report: median compensation. Below is a graph of its YoY% growth (blue) compared with YoY% of inflation (green). Notice that every time inflation, mainly fueled by Oil prices, has surged - 2006 to $90, 2009 to $147, and now to $114 - such that YoY inflation overtakes YoY median wage increases, GDP (red) slowed down acutely within several quarters:


This doesn't tell us how long the increase in Oil prices will exceed that of wages, but we can certainly say that the longer it goes on, the more will be the damage.

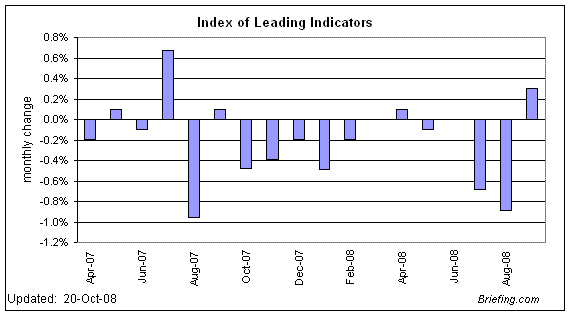
In my post several weeks ago, however, I also said I did not foresee an actual new recession. There are several data series I track which argue that, even if there will be a slowdown or stall for several quarters, a recession is not likely. Certainly with the release of April's LEI (up .4) there is no indication of any downturn this quarter. Compare this with the LEI's in 2007 and 2008:


Secondly, in order to have a recession you have to have a downturn in economic activity, and that is usually led by housing. In fact, housing permits are one of the 10 LEI above. Well, housing has been on its back for so long, that it would be difficult for it to fall futher. Here is the graph in the change in housing permits month by month since the beginning of 2007:


When housing was in free fall, we got a recession. Housing has been flatlining for two years now. If it doesn't fall, it is nearly impossible for the economy to generate a significant downturn.

A third reason is that people might be better able to withstand $4 gas due to an increased cushion of savings. Here is a graph of total personal savings:


There is no doubt that consumers have more of a stock of $$$ "fuel" to fall back on to get through this Oil shock.

Finally, the real personal savings rate (the savings rate minus the inflation rate) is an excellent leading indicator for GDP in the future. While this has fallen significantly, it is still positive


-- and we have not yet seen the full effects of the very high level of savings for the last couple of years, as that stockpile of "fuel" is gradually expended.

All of these argue that the Oil shock, particularly if it is short-lived, will lead to a short stall rather than an actual renewed recession.


Wednesday Commodities Round-up

Below are six, longer term futures contracts. I have put them up to demonstrate the futures prices are falling or stalling in a number of markets. There are several reasons this is important.

1.) It lowers the possibility of inflationary pressures
2.) I could mean that supply/demand issues are coming back into balance
3.) There may be a bet that the world economies are slowing, thereby lowering futures demand.


Tuesday, May 3, 2011

Employment preview

- by New Deal democrat

With the updating of GDP and April sales data, let's take a look at two leading indicators for employment growth.

First of all, real YoY GDP (minus 2%) tends to lead employment by about a quarter or two. This relationship has held up well both during the "great recession" and also the recovery since then. Unfortunately it suggest that 3-6 months from now we will see very sluggish job growth. As in 5 figures, or possibly even one or two negative months:


Now here is the comparison including March real retail sales (which, you may recall, were negative for the first time since last summer):


This relationship gives room for more optimism, although candidly it is disappointing that the relationship has not fared so well during the recovery (although it is closer if we look at hours worked rather than jobs created).

We really need commodity prices and especailly gasoline to reverse trajectory. If there is another Oil-shock stall, there is going to be another stall in employment, which is the last thing we need.

India Raises Interest Rates 50 BP

From the WSJ:

India's central bank raised its lending rate by 0.50 percentage point Tuesday and announced a new monetary policy framework, escalating its fight against inflation even as it lowered its forecast for this year's economic growth.

The Reserve Bank of India, which usually increases lending rates by 0.25 percentage point at a time, on Tuesday raised a key lending rate by an unexpected 0.50 percentage point to 7.25%, highlighting the urgency of taming price pressures that threaten to dampen the country's economic growth.

.....

With Tuesday's hikes, the RBI has raised the repo rate by 2.50 percentage points and the reverse repo rate by 3.00 percentage points in little over a year.

.....

The RBI's attempts to tame inflation have been insufficient so far. Originally driven by food prices, inflation in recent months has hit manufactured goods as well, raising the specter of a wage-price spiral.

Headline inflation came in at 8.98% in March, nearly a full percentage point higher than the RBI's estimate of 8%.

The RBI expects the economy to expand around 8% in the current fiscal year, lower than the 8.6% the economy is estimated to have grown last fiscal year. The government expects the economy to grow as much as 9.25% this fiscal year.

While Brazil has lower overall inflation, they are in the same position: they have a growing economy that has inflationary pressures building up. As such, they will probably continue to raise rates as well.

This has important implications for the US dollar. As other countries raise their interest rates, their currencies will appreciate in value relative to the dollar, thereby lowering the dollar's value. In addition, most of these countries also have a higher growth rate -- another attraction for currency traders. In short, this news adds downward pressure to the dollar.

The Great Depression, Part 2

I'm going to continue looking at the Great Depression from a different perspective; that of the year to year percentage change in various GDP components. Unfortunately, the BEA's data is only for annual numbers.


The above chart shows the year to year percentage change in GDP. For the years 1929 to 1933 we see a contraction, but then strong growth ensures -- 10.9% in 1934, 8.9% in 1935 and 13% in 1936. 1937 shows a decrease in the rate of growth to 5.1% -- which is still good. 1938 shows a slight contraction followed by a rise of 8.1% in 1939. What this chart demonstrates very clearly is growth did occur in the later half of the decade -- and the growth was of strong rates.


The early years of the Depression saw a strong drop in personal consumption expenditures with annual drops in the 5%-9% range. However, by 19323 the rate of annual decline was slowing and the years 1934-1937 saw good year to year growth.


The above chart shows the year to year percentage change in gross private domestic investment. Notice the collapse from 1929-1933 with terrible annual drops of 33%, 37% and 69%. That represents a near collapse. However, the years 1933-1937 show a strong rebound. Part of that is due to the low readings of 1933. But that only holds up for the first few years of the rebound; for by 1937 total inflation-adjusted domestic investment was at its 1929 level, meaning the rebound was complete.


Finally, notice the year to year percentage change in government spending was on a clear downward trajectory for the years 1930-1934. There were increases from 1934-1936; two of those years showed large increases, but one year showed only a slight increase. Also remember the middle years of the Depression is when GDP started increasing at s

Treasury Tuesdays

Last week I wrote the following about the Treasury market:

I'm treating the current action as a consolidation range and would wait to make a trading move until after prices convincingly choose a direction. For the IEFs, that would be a move above 94-94.5 or a move below 92. For the TLTs, it would be a move above 93.5 or a move below 90.

The long end of the curve is still contained by the 200 day EMA -- a technically important development. In addition, the Treasury market is still in a trading range. Until we see a convincing move in either direction, I would not be trading this market.


As with last week, very little has occurred this week to change my opinion.


The IEFs have hit the 94.5 price area, but retreated. Also note the line chart helps to further clarify where prices are; prices have been meandering and fluctuating around various levels, but there has been no strong move in either direction.


The TLTs are right at the 93.5 level. But notice they have been rebuffed two times now. Also note the declining volume, indicating a lack of excitement or momentum.


Notice how the IEF prices have been fluctuating around the 200 day EMA along with their respective EMAs. All the shorter EMAs are moving higher and the shorter are above the longer. However, the EMAs are still around the 200 day EMA.


After hitting resistance at the 200 day EMA, prices have moved beyond that level only to stall. While the shorter EMAs are moving higher, they are below the 200 day EMA. Also note the lack of volume, taking away from the advance.

Overall this is still an undecided market. The EMAs are jumbled and prices have been floating around the 200 day EMA. What is interesting is that despite the continued calls of rampant inflation, prices have not sold off. In addition, at this point in the stock market rally, Treasury prices would typically start to sell off as traders began to anticipate the Fed's first post recession tightening move. But with the Fed still in a very easy interest rate stance, that will not be happening anytime soon.

Monday, May 2, 2011

The Cure For High Commodity Prices Is High Commodity Prices

From the WSJ:

The months-long rally in commodity prices has sparked fears it could ignite inflation or cripple consumer spending. But a surprising trend is now sweeping the markets for some key materials: Prices are falling.

Goods from cotton to zinc that were highfliers late last year have turned into laggards in recent weeks. Several have logged double-digit-percentage declines in futures markets.

Cotton has pulled back 17% from the all-time record set in early March, and sugar is down 34% from its multidecade high in February. Lead and zinc have tumbled in recent weeks after shooting up in the second half of 2010. Copper has shed 6% this year.

The declines came amid a wild April in which other raw materials continued to climb. U.S. oil prices rose 7% for the month, while gold set fresh records in nominal terms 13 times and silver neared its all-time high.

The wild ride continued early Monday, when spot silver suffered one of its worst drops on record, falling 12% in 11 minutes at its most severe. It opened at $47.863 an ounce, rose to $48.150, then in 20 minutes fell to $42.210 before stabilizing. The selloff also hit spot gold, which fell 2.2% in just over a half-hour to $1,542.61 an ounce from $1,576.52.

Reasons vary for the pullbacks. Prices for some materials have fallen as ample production has eased shortage fears. The appetites for others have faltered after China and other fast-expanding nations moved to tamp down growth.

But the declines could also signal that prices rose too sharply in recent months and became unmoored from fundamental forces of supply and demand, which typically reassert themselves over time.

"A lot of those markets were technically overbought," said Brad Zigler, editor of Hard Assets Investor, an online newsletter. "Commodities are a volatile asset class, and you've got to anticipate that what goes up fast can come down fast."

The Great Depression, Part 1

Nothing seems to get people more interested in arguing about economics than talking about the Great Depression. To some people it was the greatest economic success of the last 100 years, while others argue it was the beginning of the massive welfare state which has destroyed civilization as we know it.

Regardless of your political orientation, there is one common thread to both sides of the discussion about the Great Depression: a remarkable and perhaps understandable focus on the politics of the time rather than the pure economic data. So this week all I'm going to look at is data to explain what happened.


Let's start with GDP, which the above chart shows in real (inflation-adjusted) terms. Notice the "V" shape. The economy contracted from the years 1929-1933 but then expanded from 1933 onward with the exception of a dip in 1938. Also note that by 1939, real GDP was at a decent rate above the 1929 level. This chart tells us there was plenty of actual economic growth during the Great Depression.


One of the common arguments made against the idea of government spending is that an increase in government spending will crowd out private spending. However, the above chart shows that did not happen. While private investment did contract from 1929-1932, we saw a slight uptick in 1933 followed by strong advances in the years 1934-1937. In 1938 there was a drop down but levels started to rise again in 1939. This chart demonstrates that private investment rebounded fairly quickly during the Great Depression.


The above chart shows government spending as a percentage of GDP. Notice that the highest level this reached during the Great Depression was 22.4% in 1932. These levels are commensurate with those that exist today.

The point of the above charts is to illustrate that the entire decade was not one of complete disaster; for the latter half of the decade the economy grew quite well. Next, we'll look at other macro-statistics.

Macroeconomics is a rancid, putrefying pseudoscience

- by New Deal democrat

Berkeley Prof. Brad Delong has sounded another clarion call for the discipline of economics to examine why the dominant neoliberal model so spectacularly failed in the last 5 years:

[W]hat astonishes me even more is the apparent failure of academic economics to take steps to prepare itself for the future. “We need to change our hiring patterns,” I expected to hear economics departments around the world say in the wake of the crisis.

The fact is that we need fewer efficient-markets theorists and more people who work on microstructure, limits to arbitrage, and cognitive biases. We need fewer equilibrium business-cycle theorists and more old-fashioned Keynesians and monetarists....

Yet that is not what economics departments are saying nowadays.
Indeed, unintentioinally a prime example of the failure of macroeconomics to confront the root causes of its disaster was written on Sunday Yale Prof. Robert Shiller in the New York Times. Shiller claimed:

[F]ew argued convincingly during the last decade that the most recent economic crisis was near. ...
... [T]he theory of outlier events doesn’t actually say that they cannot eventually be predicted. Many of them can be, if the right questions are asked and we use new and better data. Hurricanes, for example, were once black-swan events. Now we can forecast their likely formation and path pretty well, enough to significantly reduce the loss of life.
Such predictions are a crucial challenge in economics, too, and they are why data collection ... can be very revealing.
Sigh. It seems that progress is likely to come "one funeral at a time." Only when the powerful astrologers are gone, can actual astronomers stand a chance to formulate the science.

Let's take Shiller's example of hurricanes. Everything he says is true. But now let's add in human behavior. It is almost universally accepted among the scientific community that global warming is real, and the only issue is how much of it is caused by human activity - reams and reams of data say so. One of the consequences of global warming is said to be more frequent and more powerful hurricanes. We can only "avoid" the consequence of more frequent and powerful hurricanes if we can CHANGE the human behavior that makes them more likely. Despite the near-universal agreement among those doing the science, has anybody noticed any success there?

In other words, data collection is just so much more toilet paper unless human beings believe it and act on it. If you don't know how human beings will react to tranquility and change, any attempt to predict or change a bad outcome of human behavior is pseudoscience. You may as well use astrology.

For example, have economists yet explained last summer's sudden economic slowdown, or why it ended? No. True we very, very briefly had $90 Oil, and we had the expiration of the $8000 home buyer's credit, but that is only part of the reason. I have argued instead a non-economic explanation, that it was a classic case of classic psychological conditioning. Dog hears bell, dog receives shock. The next time the dog hears the bell, it cringes, anticipating a shock. Last spring the Euro crisis recapitulated the early stages of the 2008 financial crisis. LIBOR rates surged. Businesses and consumers froze, fearing a repeat of 2008. (It also didn't help that Americans could see live video, 24/7, of a potentially cataclysmic Oil volcano erupting on the bottom of the Gulf of Mexico). The economy stalled. When the Euro crisis abated (and the well was capped), the economy unfroze.

Prof. Hamilton has incorporated the concept of human behavior change into his theory of Oil price shocks. According to Hamilton, once Oil hits 6% of consumer spending, AND if the price is a "shock" - i.e., we haven't just seen this price already, it is a new, higher price than the recent past - then consumers alter their behavior, ultimately cutting back spending more than twice as much as the Oil price increases directly change their costs.

Let's return to Shiller's starting point: that "[F]ew argued convincingly during the last decade that the most recent economic crisis was near."

That isn't a coincidence. It is precisely because so few argued convincingly, that the crisis happened! Suppose in 2004 the 100 most prominent economists had all descended on Washington, and written in every mainstream publication that low interest rates, almost total non-enforcement of financial fraud laws, and burgeoning leveraged side-bets on housing were going to lead to a debt crisis. If they were to succeed in changing behavior (even just the enforcement of existing regulatory authority), the crisis simply would not happen. If they were met with universal complacency, the crisis would still occur.

Put more simply: we avoided Great Depression 2.0 in 2009 because we remember the history of the Great Depression. But we peered into the abyss because we forgot the 1920's and repeated in more modern form almost all that decade's vices. We do have lots of data from the 1920's - but nobody in power believed it was relevant any more.

Macroeconomists don't simply need to collect more data. Nor do they need to change graduate school education. What is needed instead is a root-and-branch rewriting of undergraduate Economics 101.

First, patently ridiculous assumptions about human behavior must never be taught. Economics 101 assumes that humans act to maximize the ethereal "utility," that their tastes are unchanging, and are never satiated. Meanwhile in the next building Psychology 101 - based on actual evidence - teaches that humans like variety, their drives are satiable, and they are veritable learning, copy-catting, adaptive (and maladaptive) dynamos.

Second, static equations imported from 19th century physics won't do. That humans are learning, copy-catting, and behavior-changing dynamos whose tastes change and whose drives can be satiated means that dynamic, not static, systems must be modeled. For example, via heterodox Prof. Steve Keen, Geophysicist Dr. Geoff Davies has used dynamic equations from his field to create a dynamic model of a credit bubble and bust.

The need for more data is only a start. When economists base their models on actual human behavior, based on actual data about that behavior including how it changes, and feed that data into a dynamic system, then they might stand a chance of actually foreseeing more potential crises and at least averting some of them. Of course, such a system might show that once a living generation passes, its lessons become unlearned - just as US elites forgot, denigrated, and ignored the data from the 1920's.

But until macroeconomics really and truly questions its basic assumptions and methodologies, it will remain a rancid, putrefying pseudoscience in a state of self-denial.

Equity Week in Review and Preview of the Upcoming Week/Month

Last week, the market moved higher, which I did not think would happen. As I have stated for the last few weeks (see here, here and here), my underlying concern is the macro environment which is turning neutral (see NDDs Friday high frequency indicators report for more information) which I believe would have prevented the move higher. Obviously, the market did not agree.

So -- the question going forward for this week is the current rally a technical development -- that is, is the market merely acting on technical data -- or, is there a strong fundamental reason for the market to move higher? Currently, we don't have any confirming underlying data for the rally which is my primary criteria to believe the advance is for real. But this week, we get a slew of data which will either provide the requisite confirmation -- or not. The most important for me is Friday's employment report. The last few reports have been encouraging, but we have seen an unwelcome increase in initial unemployment claims over 400,000 for the last few weeks which could indicate the employment situation is weakening (see this link for a good discussion on the topic). We also get both ISMs - with the manufacturing ISM being of particular importance considering the recent drop in three regional manufacturing indexes.

A third possible explanation of the market is that of leading indicator; the market is saying the first quarter is an anomaly and growth will return in the second quarter. As such, traders are getting in on the rally at the earliest possible moment. That is always a possibility; that we are seeing a hiccup in growth and things will get better soon. I'm not completely sold on that idea as of yet, although it is a reasonable explanation. I'd be more comfortable with that analysis if prices at the pump were cheaper and initial claims weren't increasing.

At minimum, I'd wait until the unemployment report before moving into the market. But even then, I'm not thrilled by this advance. Overall, gas prices are high, 1st quarter GDP was low, other commodities' upward moves have stalled, and the bond market is also moving higher. And if we are seeing an advance rally that indicates the economy is experiencing a "hiccup" rather than a stall, there will be other buying opportunities.

That being said, let's look at the technical side of the market, which is clearly bullish:


First, prices have moved to new highs, which is always indicative of a bull market. In addition, this move higher is confirmed by the rising A/D and CMF and MACD -- which has a fair amount of room to run at this point. Also note the bullish orientation of the EMAs -- all are moving higher, the shorter are above the longer and prices are using the EMAs for technical support. Technically, it does not get much more bullish.


The QQQQs have the same analysis, save for the fact prices have not moved through new highs in a meaningful way yet.

Technically, the above charts are fine and indicate a further advance. But, as I've said before, I don't think the fundamental situation warrants it.