Saturday, October 15, 2022

Weekly Indicators for October 10 - 14 at Seeking Alpha


 - by New Deal democrat

My Weekly Indicators post is up at Seeking Alpha.

Just about everything looks awful. And one bright spot, consumer spending as measured by Redbook, just got dimmer.

Needless to say, if consumer spending rolls over, that’s pretty much the ball game..

You can be brought up to the virtual moment in the ugliness by clicking over and reading, and it will reward me a little bit for my efforts.

Friday, October 14, 2022

September real retail sales lay another egg


 - by New Deal democrat

One of my favorite indicators, retail sales, was reported for September this morning, and it came in unchanged. Which means that after factoring in +0.4% inflation in September, real retail sales were down -0.4%.

Which is not good, because real retail sales have gone nowhere in 18 months, and have been down every single month since April with the exception of August, and are now down -1.4% since then:


Furthermore, real retail sales being negative YoY for more than a couple of months has for the past 75 years been an excellent coincident to short leading indicator for an oncoming recession:


The only false positives are 1951 and 1966. In September, the YoY change was exactly *0*. Our current situation - of half a year of monthly readings just above or below zero - is very similar to the first half of 2007, and we know how that wound up!

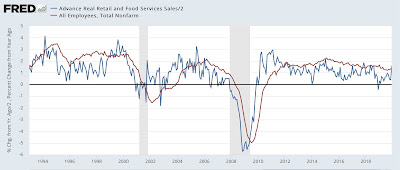
Next, As I note almost every month, real retail sales (/2) are a good short leading indicator for employment. Here’s the long term view from 1993-2019:


To avoid issues with scale, I am skipping the data from 2020 and early 2021. Here is the updated comparison with payrolls since June 2021:


Retail sales continue to forecast a deceleration in monthly payroll gains. Last autumn’s Booming payroll gains are a thing of the past. While there will always be monthly outliers, payroll gains averaging under 0.2% (about 300,000) - and gradually decelerating more - are what we should expect for the rest of this year. 


Thursday, October 13, 2022

September consumer inflation: primarily a function of the fictitious “owners’ equivalent rent” plus new cars


 - by New Deal democrat

Since last November I’ve been hammering the fact that the official CPI measure of housing inflation, “owners’ equivalent rent,” seriously lagged, as in by a year or more, actual house prices as measured by the most popular housing indexes. At the time I wrote that OER was only up 3.1% YoY and core inflation was only up 4.6% YoY. I said then, and I have reiterated almost every month since, that because of this serious lag, OER was going to rise probably to 7.5% YoY or more, and drag core CPI along with it.


Here’s just a few highlights of what I have written since then, beginning with December:

“Last month I wrote that inflation was “a Big Deal,” because it showed that consumers were already under pressure, and because, via owners’ equivalent rent, we could expect higher inflation to continue next year. Today’s report only reinforced that concern. While we haven’t crossed a threshold at this point into a downturn consistent with a recession, we certainly are at a point where a sharp deceleration beginning with the consumer sector of the economy is more likely than not.”

And since then, the consumer certainly has slowed down. In fact, consumer spending has been essentially flat (up 0.7%) in real terms in the last 12 months.


“I fully expect the housing component of inflation to continue to worsen considerably.”

 Then in May I wrote:

the current rise in house prices of nearly 20% YoY, is significantly worse than either of the previous two - and has been up almost 20% YoY for the last 8 months running. With CPI housing inflation already at a 20 year high, we can further record CPI housing increases as this year progresses.”

And in August I wrote:

Since house prices had not meaningfully decelerated through May, the last month measured in the index, it is still likely that OER has not hit its YoY peak. We are likely to see the highest YoY% increase for OER ever before this episode is over.”

Since house price indexes have historically been about twice as volatile as OER, and peaked at about +20% YoY, I have anticipated that the OER component of inflation could go as high as close to 10%.

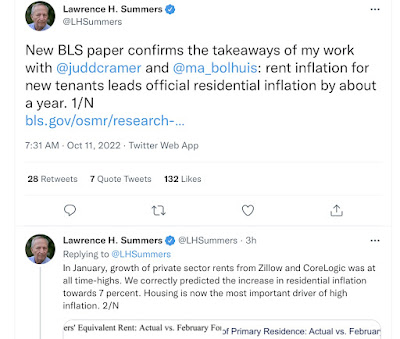
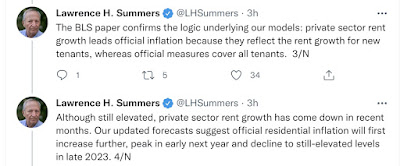
This week that notion finally made it to the top of the academic economic establishment, as Larry Summers wrote:


And Paul Krugman responded:


Here is the projected path of OER as forecast by Summers:


All of which I forecast almost one full year ago.

So let’s look at how badly OER skewed core inflation in September, from this morning’s report. To cut to the chase, without OER total inflation would have been up 0.3%, and core inflation up 0.4%, vs. the reported numbers of +0.4% and +0.6%, respectively. 


Here are the headlines with attendant graphs:
Total CPI +0.4% +8.2% YoY (less than 0.1% decrease from last month)
“Core” CPI +0.6% +6.7% YoY (new 40 year high)

Monthly:

YoY:


Owners’ equivalent rent +0.8% +6.7% YoY (new all time YoY high, exactly as I forecast) compared with the FHFA purchase only house price index (black, /2 for scale):


Energy -2.1% +19.9% YoY (down from +41.5% YoY in June):


Used vehicles -1.1% +7.2% YoY (down from +41.2% in February
New vehicles +0.7% +9.4% YoY (down from +13.2% in April)

Index values:

YoY:


In essence, inflation at this point is primarily a function of the fictitious and lagging measure of housing that is used by the Census Bureau (even though the house price indexes peaked in May and June, and turned down slightly in July), plus the shortage of computer chips for manufacturing vehicles.

In hiking rates, the Fed is chasing a phantom, lagging, menace.

UPDATE: And here is Krugman’s reaction:
Only 11 months after I highlighted the same issue - and forecast exactly where we are today - it’s nice to see a top academic “get it.”

UPDATE #2: Here is what core inflation without OER looks like - it is declining:


Initial claims continue to rise along with gas prices


 - by New Deal democrat

Last week I wrote that initial jobless claims may have ended their recent downtrend. This week appears to have confirmed that.

Initial claims rose 9,000 to 228,000, and the 4 week average rose 5,000 to 211,500. Continuing claims, which lag somewhat, increased 3,000 to 1,368,000:


With OPEC deliberately cutting back production in order to cause a shortage in Europe and the US this winter (to aid Russia, and also the GOP in the midterm elections), gas prices will likely continue to rise. I would expect jobless claims to continue rise as well. Whether this is the final rise before a recession signal is impossible to know just yet.

Wednesday, October 12, 2022

As the economy slows, so has producer price growth


 - by New Deal democrat

Consumer prices for September will be released tomorrow. This morning the upstream producer prices were released. Total PPI rose by 0.4%, after two straight months of decline; but excluding those and December 2021, the lowest monthly increase since November 2020. Here are the monthly changes compared with CPI:


YoY producer prices increased at the lowest rate in a little over a year:


Core PPI increased by 0.2% (blue in the graph below), which was the lowest reading since December 2020, and in line with historical pre-pandemic readings, in contrast to the continued elevation in core CPI (gold):


PPI’s primary housing component is residential construction materials. Here are the absolute values in both flavors of that reading, normed to 100 as of January of this year:


Note that both have declined in the last few months, with construction materials down -2.6% since January, and goods inputs essentially flat since March. Both are still very elevated, up over 33% since the end of 2020. But at least they are o longer rising.

With a slower economy, as expected producer prices are easing. Tomorrow we will find out just how much Owners’ Equivalent Rent is distorting consumer prices to the upside.

Tuesday, October 11, 2022

For Indigenous Peoples’ Day: on the centrality of mass migrations to human history


 - by New Deal democrat

I just finished reading Susan Wise Bauer’s “The History of the Ancient World,” which in a little under 800 pages summarizes an almost endless string of kings and battles from the earliest written records kept by the Sumerians around 3000 BC through the accession of Constantine as Roman Emperor in 306 AD. 


It is timely to consider it in reference to Indigenous Peoples’ Day in the US, as what both have in common is the centrality of big migrations of humanity to conflict and the rise and fall of civilizations. The migration of many millions of people primarily from Europe, but also some from Asia, and also the involuntary importation of slaves from Africa to the Americas, is one of the largest such displacements ever, but large movements of people have been going on since the dawn of humanity, and continue now (as, for example, the migrations from Latin to North America, and from North Africa and the Middle East to Europe) - and with similar problems.

Indeed, the history, and indeed pre-history of humanity seems largely centered on such migrations.

About half a year ago I completed and reviewed “The Dawn of Everything,” an extensive review of human prehistory for the past 30,000 or so years, contrasting it with Yuval Noah Harari’s “Sapiens.” Here is a little of what I wrote then:

Why did “civilization” begin? I think Harari has the better argument. Graeber and Wengrow think that civilization drives population growth; but the evidence is most consistent with the reverse causation, i.e., population growth drove the necessity for more organized and permanent food production, and for denser and permanent  living arrangements. Harari notes just how exponential long term human population growth has been. Only 2500 years ago, during the golden age of Athens or the first Chinese dynasty, human population was only about *1%* of what it is now.

“In any event, [“The Dawn of Everything” makes] a good argument that historically the default government for most human populations hasn’t been dynasty or autocracy, but rather small-scale Republics, with pre-set rules and public participation (Vindication for John Rawls!).”

Bauer picks up just about where “The Dawn of Everything” leaves off. The latter uses archeology and anthropology to sketch what human civilization looked like before writing came into use. Bauer explicitly uses writing as her dividing line between pre-history and history. She starts with, and almost exclusively bases her narrative upon, written records, the first of which were made by the Sumerians about 5000 years ago. Because she explicitly limits discussion to those cultures with written records, there is no discussion of life in the Americas, Australia, or sub-Saharan Africa, nor of the northern tribes of Eurasia. Rather, the focus of the book expands as the use of writing expands, from ancient Mesopotamia to Egypt to India and China, then to the Jews, Greeks, Macedonians and Romans.

I do wish she had partnered with an archeologist, because apparently what ancients most wrote about (probably paid by their sovereigns) was the rise of and battles won by their kings, and the losses of everybody else’s kings. Cities are founded, rise, apparently prosper, and then are seized, sacked, or razed, in some cases such as Babylon many times over (one Assyrian goes so far as to not just raze Babylon, but to divert river water through the remains to turn it back into the swamp it was before it was founded. And then within 100 years it is built again). One is left to wonder why humans continued to found, and live in, cities, since they were such targets for the kingdom next door. Presumably because they were better than the wandering, nomadic alternative for most people. They must have been *relatively* prosperous and secure. A fuller fleshing out from the available archeological evidence would have been a very welcome addition.

But among the ceaseless battling, rising, and falling, there are some overarching themes in “The History of the Ancient World:”

1. There have always been large migrations of humanity.
2. They seem to be driven by both increased population and climate change.
3. Also because, in groups, humans are a**holes.

Almost all of these migrations during the period examined by Bauer are from the north. Wandering tribes found kingdoms to the north of China, northwest of India in Central Asia, in the Caucasus mountains, Asia Minor, Macedonia, and north of the Alps, and then migrate - or at least attempt to migrate - south into the “more civilized” established polities. The only instance of a threat from the South during the entire 3300 year period covered by Bauer is when the Nubians of modern day Ethiopia attack an Egyptian dynasty to their north.

Bauer does allude to climate change, partly in terms of the ability to practice agriculture in certain areas, and partly as to changing coastlines over time, e.g., the gradual increase in the size of the northern Persian Gulf, the flooding of the freshwater Black Sea, and the isolation of Great Britain from the European continent. There is also an element of over-farming, as ancient fields in the Tigris and Euphrates plains gradually salt up and fail.

But this pattern of migrations and invasions from the North is so universal that there is likely a dominant explanation. Perhaps the warming of the climate over time allowed for a *relative* bigger population increase in the sub-Arctic areas. And that increased population had to spread out somewhere. Indeed, the population on the island of Crete became so dense that 1/2 of those just reaching maturity were chosen by lot and ordered to leave the island on boats to found colonies elsewhere. The more established and fertile lands to the South seem to have been the answer - and created endless conflict as those established civilizations sought to keep the northern invaders out. And if they didn’t, they too migrated, as when some Phoenicians allied with the biblical Jezebel fled to North Africa and founded the city of Carthage. Or when the Goths and other Germanic tribes fled south into the Roman Empire in response to the Vikings’ incursions south from Scandinavia.

Also, the increased population gave rise to larger and larger empires, as successful systems of bureaucracies evolved.  The first recorded empires covered northern Mesopotamia and north and south Egypt. Similarly, the first big kingdom in China only covered a portion of the northern interior. But by 300 AD, three large empires span the Eurasian continent from west to east: Rome, Persia, and China; and the Silk Road moved money and goods among them.

There is very little evidence of peaceful co-existence, or absorption of the new settlers into existing society. When population pressures get too much, or when a faction is subject to repeated violence, they leave, and try to re-settle in areas at a sufficient distance away to avoid contact with their former neighbors. I.e., in societal groups, by and large humans are a**holes. Shades of Trumpists today! 

When successful, these conquests give rise to new civilizations, such as the Hittites of Asia Minor, or the Bactrian Greeks (from Alexander’s conquests) in eastern Persia, and northwest India. And of course, the same explanation for the migration of European religious minorities and those seeking new fortunes to the Americas after 1492, founding a new civilization and displacing and committing near genocide against the existing inhabitants, the Indigenous Americans that were honored by the holiday yesterday.

One final note: we owe a historical debt of gratitude to one ancient nerd in particular: the Assyrian King Ashurbanipal of Nineveh, in what is now northern Iraq, who reigned from 668-626 BC. Apparently alone among ancient monarchs, he made the collecting and copying all sorts of written clay tablets from across his empire a priority. These included “spells, prophecies, medical remedies, astronomical observations, stories and tales (including … the ancient hero Gilgamesh).” These were all put together in an imperial library at Nineveh, which according to Bauer held “almost thirty thousand tablets.”

Just like every other civilization, ultimately Nineveh fell, and was put to the torch. But unlike papyrus scrolls, such as those thousands destroyed in the burning of the library of Alexandria in Egypt, when clay tablets are burned, they turn to brick stone. Buried in the rubble, they remained largely intact, to be discovered during an archeological excavation during the 19th century. And available to historians like Bauer and ultimately to us, an empire of the mind that forms most of the written record of what we now know about the ancient civilizations from the beginnings of Sumeria 5000 years ago.

Monday, October 10, 2022

Scenes from the September jobs report


 - by New Deal democrat

No important economic news this week until Wednesday. I was going to put up a book review for Indigenous Peoples’ Day, but it got too long and involved, so maybe tomorrow. Instead, here’s a look at some of the more important metrics I was tracking for last Friday’s employment report.


Historically, month over month growth in jobs tends to peak near the middle of an expansion (averaged quarterly below):


Hence, it’s a mid-cycle indicator. Here’s the quarterly and monthly growth since the immediate pandemic lockdown distortions ended:


This looks like a classic slowing of jobs growth past mid-cycle.

In that regard, many times I’ve said that consumption leads employment, and that because real consumption growth monthly has all but stopped, I have expected employment growth to slow considerably as well. Here’s what that relationship measured YoY looks like updated through Friday’s report:


This relationship predicts further slowing in monthly jobs growth.

If that’s the case, we would expect the unemployment rate to increase as well. Here’s an updated look at initial jobless claims (which lead the unemployment rate) through last week vs. the unemployment rate through last Friday’s report:


I certainly do not expect any further decline in unemployment, and I do expect the unemployment rate to rise slightly at least.

The unemployment rate went down in last Friday’s report because labor force participation (which = employed + unemployed) went down slightly. Here’s what boh the employment to population ratio and labor force participation ratio for the prime 25-54 age group looks like, normed to 0 as of Friday’s report:


Except for the late 1990s Boom, the employment to population ratio is equal to the best it has been for prime age workers in the past 35 years. Labor force participation also looks excellent compared with the last 15 years, only exceeded by about the last 6 months of the last expansion; and about average for the 8 years before that since the turn of the Millennium. 

Finally, as anticipated non-supervisory wage growth measured YoY slowed. The below graph compares that (red) with the number of job openings available as measured in the JOLTS report (blue): 


Although the relationship isn’t perfect, the number of job openings is a short leading indicator for wage growth. As openings increased, with a delay so did YoY wage growth. With openings now declining, wage growth has decelerated. I expect openings to decline further (thus gradually ending the game of “reverse musical chairs” in the employment market), and with that wage growth to continue to slow as well.