-by New Deal democrat
Real personal income and spending held up well throughout the pandemic, due to a vigorous government response. This morning these were reported for the first month after the expiration of the last such assistance.
In nominal terms, personal income declined -1.0%, but spending rose 0.6%, and the previous month was revised upward by 0.2%.
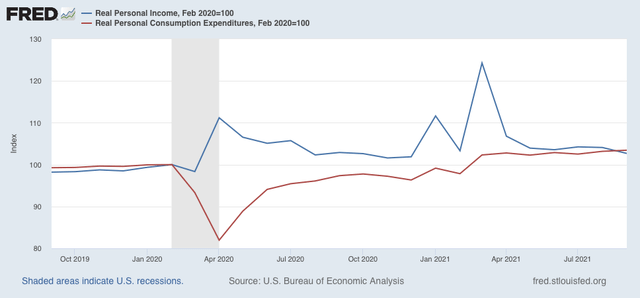
In real terms, personal income (blue in the graph below) declined -1.4%, while real personal spending (red) rose 0.3%, both well above their immediate pre-pandemic levels:

Since May, while the trend for both has been close to flat, real spending is up 1.1%, while real income (with the expiration of emergency benefits) is down -1.2%.
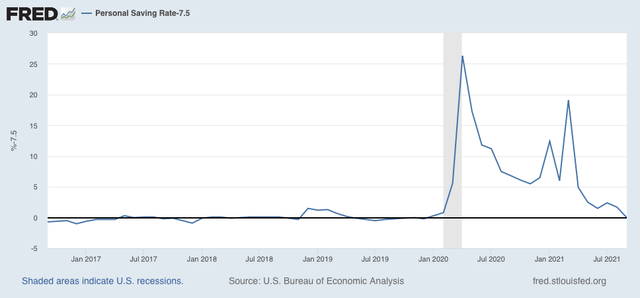
Not only did consumers spend a lot of their pandemic assistance, but they also saved a lot. This provided a “cushion” in personal savings for many. As of last month, they appear to have gone through this cushion. The personal savings rate for September was 7.5%, below the 8.3% of February 2020 just before the pandemic hit, and about average for the 4 previous years, as shown in the graph below which subtracts -7.5% across the board:

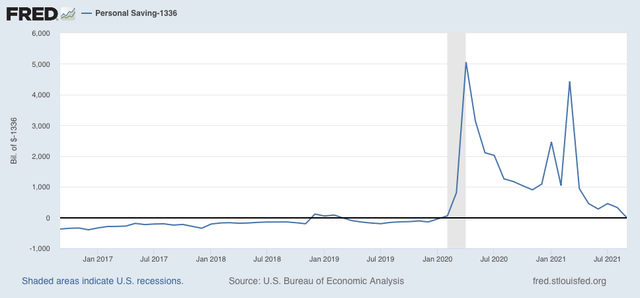
This is also shown in the graph of total personal savings, which at $1,336 Billion, has also returned to the level it was just before the pandemic hit:

In other words, from here on in, people’s spending is going to be based upon “normal” factors, with no special stimulus to help them out.
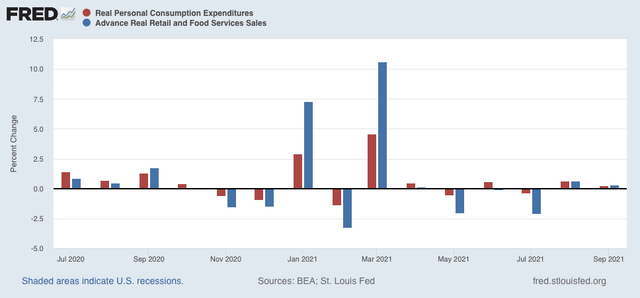
Finally, real personal spending is basically the other side of the coin compared with real retail sales, since they cover the seller and buyer of consumer transactions, which is over 2/3’s of the entire economy. Here is a graph comparing the monthly %age change in each since July 2020:

Both of these have returned to basically normal levels m/m, as both increased 0.3% in September.
Last month I wrote that, “with the total expiration of emergency measures, the next few months will be much more challenging.” This only intensifies after this month’s report showed, as above, that consumer’s “cushion” has run out.