Saturday, March 29, 2014
Weekly Indicators for March 24-28 at XE.com
- by New Deal democrat
OMG it's 'green shoots'!!!
There's been a definite "spring-ing back" in the indicators in the last two weeks.
Friday, March 28, 2014
Why I disagree that real private fixed residential investment forecasts economic improvement this year
- by New Deal democrat
Bill McBride a/k/a the nicest blogger in the econoblogosphere has forecast a strong 2014, which is in contrast to my forecast for deceleration (i.e., positive but at a declining rate).
I wanted to lay out factually why, even though I have the utmost respect for Bill, I have disagreed. The first post, dealing with real private fixed residential investment, is up at XE.com.
Thursday, March 27, 2014
My housing bet with Calculated Risk: February results
- by New Deal democrat
As most readers know Bill McBride a/k/a Calculated Risk and I have a charitable bet about the direction of housing in 2014.
In his forecast for 2014 residential investment, CR said, "I expect growth for new home sales and housing starts in the 20% range in 2014 compared to 2013."
By contrast, several months ago, in a post at XE.com, I said that "If the typical past pattern is followed, we will shortly see permits running 100,000 less than one year previously."
By contrast, several months ago, in a post at XE.com, I said that "If the typical past pattern is followed, we will shortly see permits running 100,000 less than one year previously."
Here are the terms of our bet: If starts or sales are up at least 20% YoY in any month in 2014, I will make a $100 donation to the charity of Bill's choice, which he has designated as the Memorial Fund in honor of his late co-blogger, Tanta. If housing permits or starts are down 100,000 YoY at least once in 2014, he make a $100 donation to the charity of my choice, which is the Alzheimer's Association.
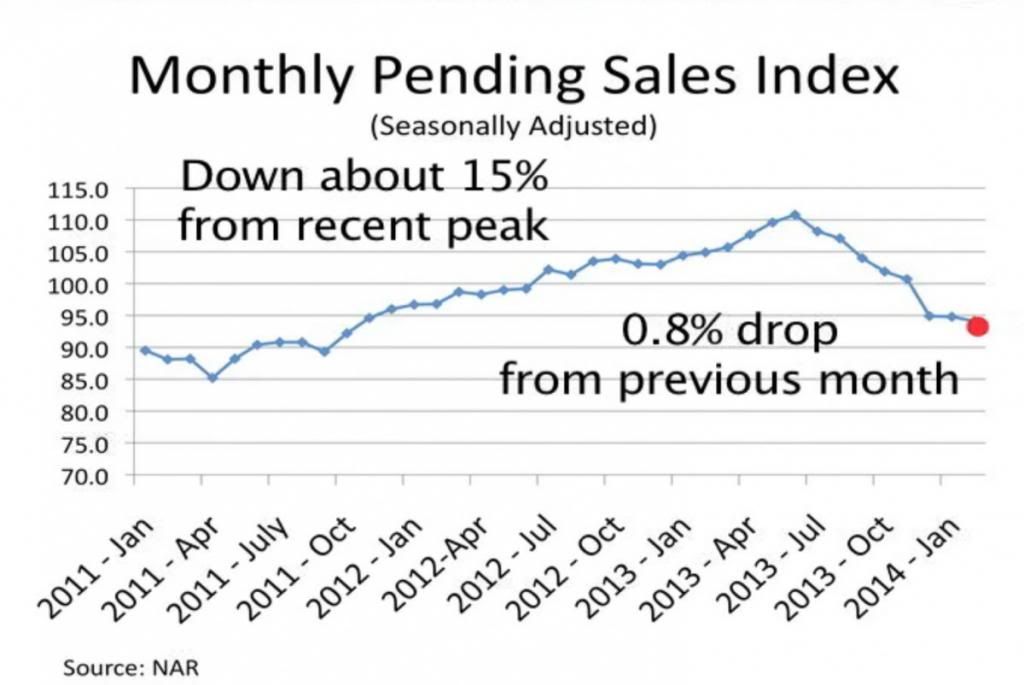
This morning the final monthly report on housing for February, pending home sales, was reported by the NAR. The index was down -0.8% m/m from January, but down -10.2% YoY, and in fact was the lowest reading in over 2 years:
This morning the final monthly report on housing for February, pending home sales, was reported by the NAR. The index was down -0.8% m/m from January, but down -10.2% YoY, and in fact was the lowest reading in over 2 years:

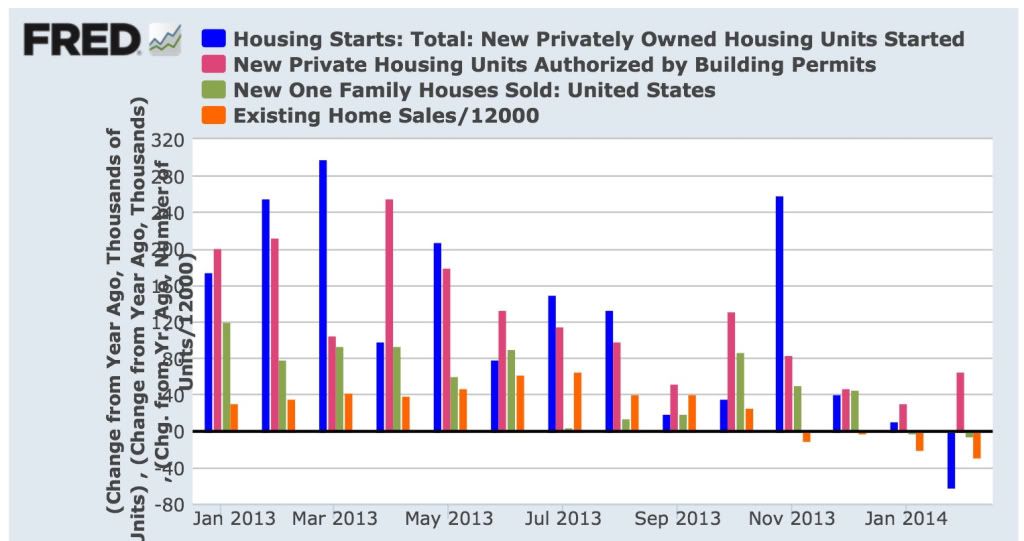
First, here is a graph of the change, in thousands, YoY of starts (blue), permits (red), new home sales (green), and existing home sales (orange) (note that the St. Louis FRED does not track pending home sales):

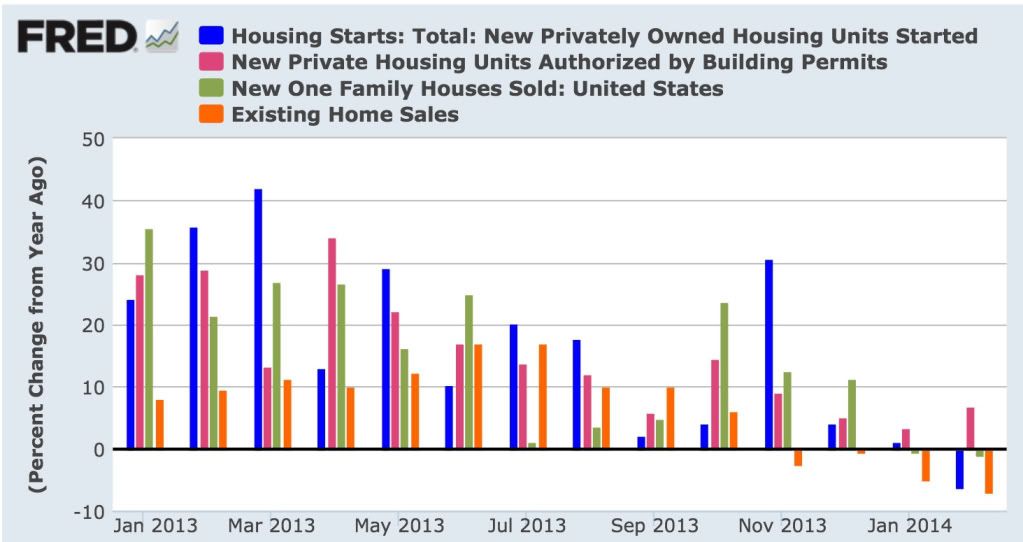
Next, here is the YoY% change in the same four statistics:

Both of these graphs show the clear deceleration in the housing market through 2013 and further into February 2014, to the point where 4 of the 5 monthly reports have turned negative YoY. The strongest metric is housing permits, which rebounded slightly from a +3.3% YoY reading in January to a +6.5% rYoY eading in February. Nevertheless, the graphs make clear that except for permits, deceleration has turned into outright YoY decline.
Bill's forecast of 20% annual growth will take a real reversal of momentum (housing starts and sales will have to be up about 25% on average YoY for the next 10 months), although there are some individual months where there are some easy YoY comparisons. Obviously I am expecting some further deterioration, concentrated between now and mid-year.
Most people seem to be either surprised by or ignoring the housing slowdown. And yet there is no doubt that the trend has turned negative as I forecast it would.
Initial claims return to post-recession lows; gross domestic income improves
- by New Deal democrat
Just a couple of quick hits about data released this morning.
First of all, initial claims, at 311,000, caused the 4 week moving average to decline to 317,650, which is the lowest reading since the Great Recession with the exception of 3 weeks last September (and before that, October 2007!). This bodes well for the unemployment rate in the March or April jobs report, since initial jobless claims tend to lead the unemploymeet rate in the payrolls report.
In the rear view mirror, fourth quarter gross domestic income was reported at +2.7%. Gross domestic income is the mirror image of gross domestic product, and it is generally thought that GDP resolves in the direction of GDI. Although "old" information, it confirms that we have not been on the verge of contraction.
The good initial claims report in particular is potent evidence that the wintertime slump has ended.
More Signs Of A Short-Term US Equity Market Top
The IWMs (top chart) have moved through the 117 level, although the longer-term uptrend is still in place. The real concern now is the QQQ chart, where prices are right at long-term support with decreasing momentum and negative volume flow.
And finally, the DIA double top is still in play.
Wednesday, March 26, 2014
India ETF Breaks Through Resistance
The Indian ETF above had been hitting resistance in the upper 56-upper 57 region since 4Q of 2013. However, prices have now moved through that level and are advancing higher. The reason is hope the new government will be more business friendly:
On Wednesday, India’s two benchmark stock indexes, the Sensex and the Nifty, each rallied to their third new high this week. The foreign funds coming in to buy Indian stocks have shored up the rupee, which has risen nearly 14 percent as of Tuesday since hitting the record low.
India’s economy remains stagnant, but much of what is driving investor optimism is the rising expectation that the opposition Bharatiya Janata Party will replace the government, led by the Indian National Congress. A B.J.P. victory would be expected to install Narendra Modi, the chief minister of Gujarat, as the new prime minister, and in a country that has a reputation of being difficult to do business in, Mr. Modi has welcomed foreign investment in his home state.
In February, a survey by the Pew Research Center showed that 63 percent of Indians polled would prefer the B.J.P. to form the next government, compared with 19 percent who picked the Congress party.
‘‘Expectations are very high that Mr. Modi will lead the new government in India, and investors are viewing that as quite a game-changing event for India going forward because of his economic track record in Gujarat,’’ said Sam Mahtani, a director of emerging market equities at F&C Investments in London, which invests $3.3 billion in emerging markets, about 10 percent of which is in India. ‘‘He is viewed as a very pro-reform leader, and that is effectively what the market is anticipating and wants.’’
Tuesday, March 25, 2014
New home sales now *also* down YoY
- by New Deal democrat
This morning the Census Bureau reported that seasonally adjusted February new home sales were 440,000, which is -1.1% lower than last February's 445,000.
January's number was revised down by -13,000 to 455,000, and not only is no longer a record, but as revised was *also* down YoY by -3,000.
That means that the only two measures of housing which were not negative YoY in January were permits and, as revised, starts. So far this month, only permits are YoY positive. (Admittedly I regard permits as the best, most forward looking measure). The last important series, pending home sales, will be reported Thursday, and I'll update all of my graphs then.
While I haven't won my bet with Bill McBride a/k/a Calculated Risk, how many of you, dear readers, believed that by this time so many measures of the housing market would be negative YoY? If I haven't specifically been proven correct on my -100,000 YoY forecast for permits or starts, I got the trend of the housing market at the beginning of this year correct.
Latin Amercan ETFs Underperforming
Above is a one year comparison chart for 6 Latin American ETFs. With the exception of Argentina, all are in negative territory. There are two underlying reasons for this. The first is the negative impact of China's economic re-balancing, which is negatively impacting countries like Peru and Chile. Consider this chart of exports from those two countries:
While exports from both countries picked-up after the great recession, both have seen a stalling since roughly mid-2010. This has also hurt Brazil, another net exporter. Mexico's economic fortunes are tied to the US' so as concerns about the US economy built, Mexico's equity index underperformed.
Monday, March 24, 2014
Can We Please Start Fixing Our Infrastructure Now?
From the NY Times:
It is a danger hidden beneath the streets of New York City, unseen and rarely noticed: 6,302 miles of pipes transporting natural gas.
Leaks, like the one that is believed to have led to the explosion that killed eight people in East Harlem this month, are startlingly common, numbering in the thousands every year, federal records show.
Consolidated Edison, whose pipes supplied the two buildings leveled by the explosion, had the highest rate of leaks in the country among natural gas operators whose networks totaled at least 100 miles, according to a New York Times analysis of records collected by the federal Department of
Transportation for 2012, the most recent year data was available.
The chief culprit, according to experts, is the perilous state of New York City’s underground network, one of the oldest in the country and a glaring example of America’s crumbling infrastructure.
In 2012 alone, Con Edison and National Grid, the other distributor of natural gas in the city, reported 9,906 leaks in their combined systems, which serve the city and Westchester County. More than half of them were considered hazardous because of the dangers they posed to people or property, federal records show. (There are more than 1.2 million miles of gas main pipes across the country. Last year, gas distributors nationwide reported an average of 12 leaks per 100 miles of those pipes.)


